
Pandas in Python
Pandas in Python
In this blog, we shall discuss Pandas. Currently, Python is the widely learned skill in the industry and pursuing Python Certification has become much popular. It is very much important to learn NumPy arrays concepts before learning Pandas. Because Pandas is available as an open-source software library with user-friendly data analysis tools and data structures that were built over NumPy. That is, Pandas will not work without NumPy. Most Data Analysts/Scientists who were working in Python use the package of Pandas which serves as the backbone for many data projects. Let’s get started. Getting started in Pandas need the following to be learned:
What is the use of Pandas?

Pandas is an important tool that is used to analyze, clean and manipulate data. Pandas could be able to handle various kinds of data namely:
- Time series data Ordered/unordered
- Tabulated Data containing heterogeneous type columns
- Data without any label
- Data containing arbitrary matrix with column and row labels
- Statistical/Observational data sets
How will you install Pandas?

Follow the simple procedure to install Pandas onto your machine:
- Open the command prompt/Terminal window.
- Type “pip install pandas” (if your system has anaconda installed, type “conda install pandas”). This will start the Pandas installation.
- After completing the installation, open your IDE (PyCharm, Jupyter, etc.)
- Type “import pandas as PD” to import it.
What do you mean by a data frame?
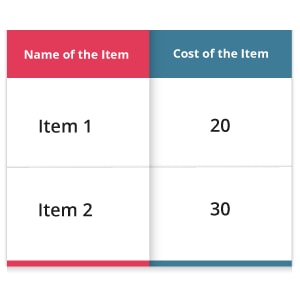
The standard way to store data is called a data frame. It is a two-dimensional array containing labeled rows and columns. Data Analysts/Scientists were much familiar with data frames. It contains tabular data where the rows will store the data and the columns will name the data. Say, for example, 20, 30 are the cost values and cost is the name of a column.
What do you mean by a Series?
A Series can be defined as a data structure with one dimension. The data structure of a series could either be an int, string or float. Suppose if you perform any task or a one-dimensional array is returned, the series will be useful in those cases. Generally, the series will not contain more columns. A Series will contain only one parameter where the data could either be a scalar value or a list or a dictionary.
pd.Series([0.1.,0.2.,0.3]) |
| 0 | 0.1 |
| 1 | 0.2 |
| 2 | 0.3 |
It is possible to add one more index with the index. The newly added index will be used to name the rows. But, the size of the rows and columns must be equal.
pd.Series([0.1.,0.2.,0.3], index=[‘x’,’y’,’z’]) |
Now, we shall create a Pandas series containing a missing value for the newly added third row. In Python, we use “NaN” to denote a missing value. To create a missing value, we shall use NumPy.
pd.Series([0.1.,0.2.,np.nan])
The output of this Pandas series will be:
| 0 | 0.1 |
| 1 | 0.2 |
| 2 | Nan |
How will you create a Data frame?
We can create a Data frame by converting a NumPy array to a pandas data frame, i.e., pd.Data frame(). We can also np.array() by converting a pandas data frame to an array.
****Conversion of NumPy to Pandas**** import NumPy as npC=[[0.1,0.2],[0.3,0.4]]ab_c=pd.DataFrame(c)print(‘Data Frame:’,ab_c) ****Conversion of Pandas to NumPy **** ab_c_d=np.array(ab_c) print(‘NumPy Array:’, ab_c_d) |
Result of Data Frame:
| 0 1 |
| 0 | 0.1 | 0.21 |
| 1 | 0.3 | 0.4 |
Result of NumPy Array:
[[0.1 0.2] [0.3 0.4]] |
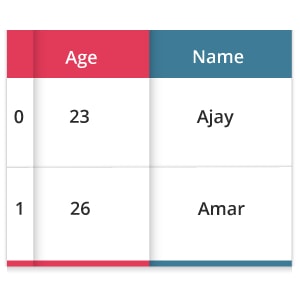
We can also create a Data frame through a dictionary.
dic =  {‘Name’:  [“Ajay”,  “Amar”],
'Age’: [23, 26]} pd.DataFrame=(data=dic)
|
How will you perform Data Slicing?
We need a data frame to slice on data. A Data frame is actually a two-dimensional data structure and is also a very common pandas object. Come on, let us create a data frame. import pandas as pd
abc_profit = {‘Day’: [1,2,3,4,5],
“Customers”:[10000 12000 15000 9000 13000],
“Profit_percentage”:[10,12,15,9,13]} xy = pd.DataFrame(abc_profit) print(xy)
|
The output of the above code will be: 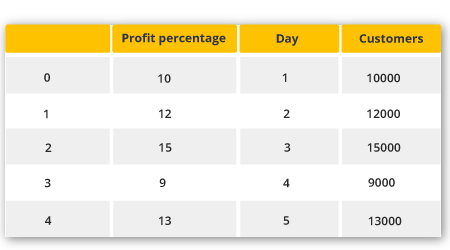
The above code will start converting a dictionary to a pandas data frame with an index to its left. Let’s start to slice a particular column alone from the data frame.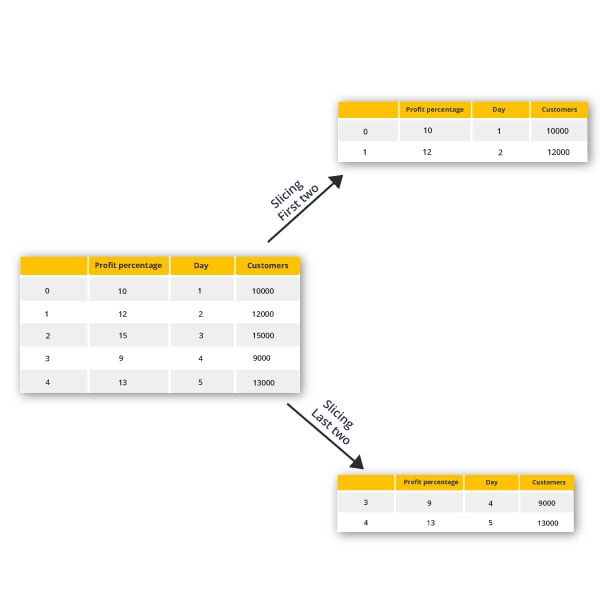
To get the starting two rows of the data frame,
print(xy.head(2)) |
Output:
| Profit_percentage | Day | Customers | |
| 0 | 10 | 1 | 10000 |
| 1 | 12 | 2 | 12000 |
And, to get the last two rows of the data frame,
print(xy.tail(2)) |
| Profit_percentage | Day | Customers | |
| 3 | 9 | 4 | 9000 |
| 4 | 13 | 5 | 13000 |
Let us move to an important topic, merging and joining data frames.
Merging and joining data frames:
Let me teach you to merge a data frame. To form a single data frame, merge two data frames in case of merging. You can pick a particular column to assign it as a common one. Say for example; let me create three data frames of which they contain some key-value pairs. Merge all the three data frames together.
import pandas as pd
dat_frame1 = pd.DataFrame({“Profit Percent:[10,14,15,16],
“Year”:[1,2,3,4],
“Amount”:[10000,14000,15000,16000]}, index=[2012,2013,2014,2015]
dat_frame2 = pd.DataFrame({“Profit Percent:[10,14,15,16],
“Year”:[1,2,3,4],
“Amount”:[10000,14000,15000,16000]}, index=[2016,2017,2018,2019])
merge_dat_frame= pd.merge(dat_frame1, dat_frame2)
print(merge_dat_frame)
|
Output:
| Profit Percent | Amount | Year | |
| 0 | 10 | 10000 | 1 |
| 1 | 14 | 14000 | 2 |
| 2 | 15 | 15000 | 3 |
| 3 | 16 | 16000 | 4 |
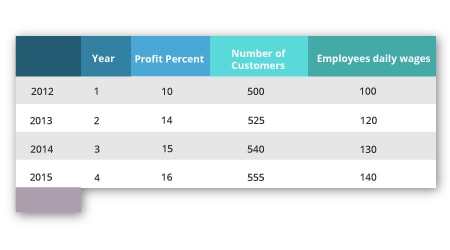
From the above example, we could be able to understand how to merge two data frames into one. Now, let us move to join. In the case of joining, we shall join two different index data frames to one data frame. Let’s see how to do it.
dat_frame1 = pd.DataFrame({“Profit Percent:[10,14,15,16],
“Year”:[1,2,3,4], “,
index=[2012,2013,2014,2015])
dat_frame2 = pd.DataFrame({"Number of Customers":[500,525,540,555],
"Employees daily wages":[100,120,130,140]},
index=[2012,2013,2014,2015])
join_dat_frame= df1.join(df2)
print(join_dat_frame)
|

 +1 201-949-7520
 +91-9707 240 250