
POWER BI TUTORIALS
Microsoft Power BI Introduction
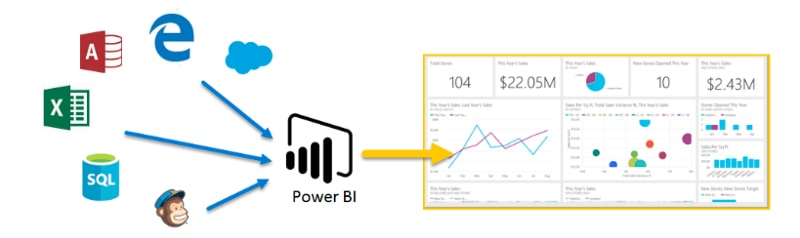
Microsoft BI is a BI platform which it provides details to the nontechnical business users to understand and analyze, visualizing and sharing the data with the respective. If you are fairly familiar with Excel & its integration with all products makes it a unique versatile self-service tool with upfront training.
Power-BI is a DV and BI tool that converts data sources to interactive dashboards. These services generally used by the users to the data.
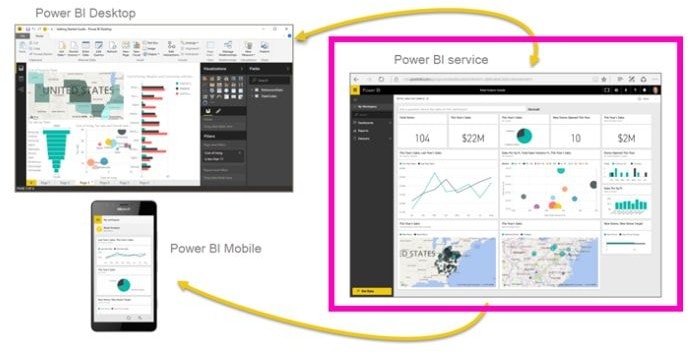
The desktop app used to generate reports, while the Services is used in publishing reports and mobile app used to view reports & dashboards.
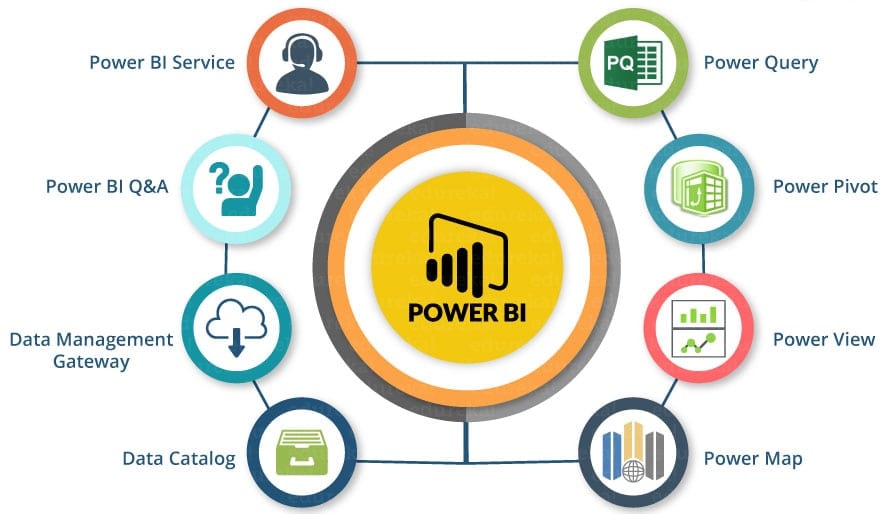
Power BI components
- Desktop− Used to create reports and dv on the dataset.
- Gateway– Uses the on-premises gateway to keep your data fresh by connecting to data sources without moving the data.
- Mobile Apps− Using mobile apps you can connect data from anywhere. Apps are available for Windows, iOS & Android platform.
- Service− Cloud service is used to publish reports and dv.
Power BI Installation
- First To check the system requirements, installation the files detail, users have to navigate to “Advanced download options”.
- Following are the system requirements to download The Power BI tool −
- Supported Operating Systems
- Windows Server 2012 R2, Windows Server 2012, Windows Server 2008 R2, Windows 8.1, Windows 8, Windows 7, Windows 10.
- Microsoft Power BI Desktop requires Internet Explorer 9 or higher
URL to download:- https://www.microsoft.com/en-us/download/details.aspx?id=45331
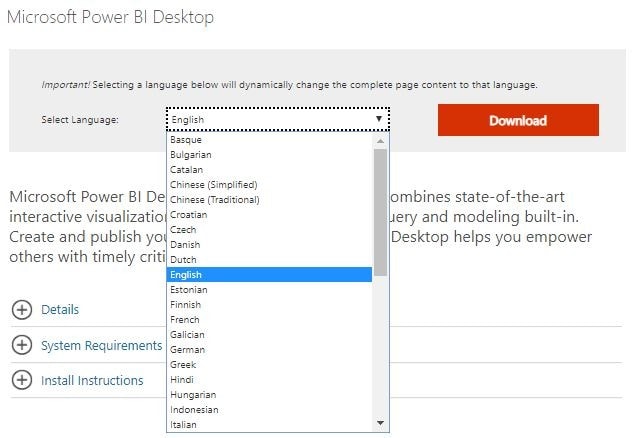
Step1:-Once click on above URL then below window will be displayed.

Step2: The user can select the language according to his requirement.
Step3: Click on Download Button then it will open below the window
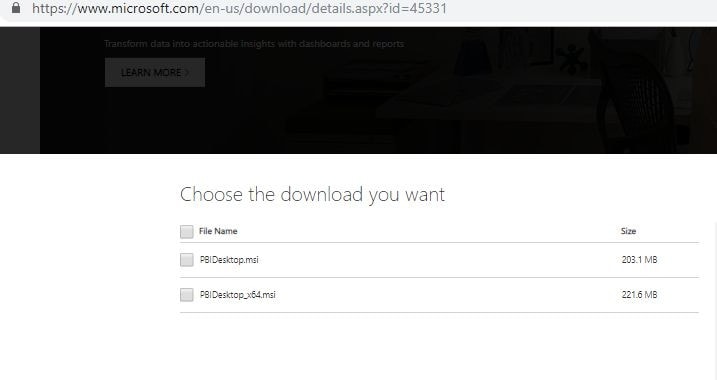
Step4: Select PBIDesktop_64.msi Option (Select another option in case if your system is 32 bit Version)
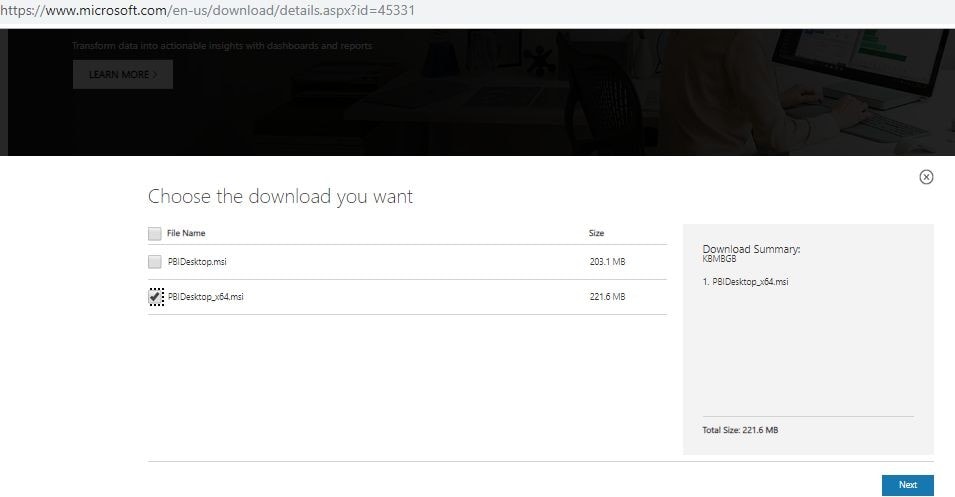
Step5: Click on next button, Then Power BI Desktop .exe file download gets started.
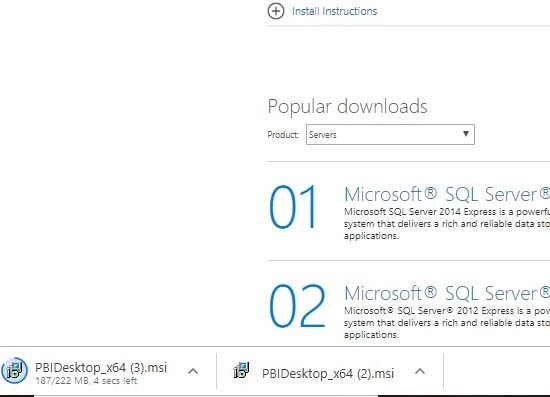
Step6: The .exe file will be available in Download Folder, Then double click on it and follow the steps (No Complex steps involved Only next you have a press) successfully PBI Desktop would get installed in your system.
Step7: Once successfully Installed go to start window button and search for it you can find the Power BI Desktop Icon.
Power BI Advantages
- Minimal Cost
- Power BI Reports Can be viewed across multiple platforms and
- Easily Can consolidate multiple data sources through Power BI
- Can Instantly Share Dashboard
- Drag and Drag Functionality
- It has Drill down and Drill through Functionality
- Schedule option for data refresh
- Write simple sentences to run report queries
- Very fast-growing Day by day
- Job opportunities are huge since the Company adoptions towards tool is very huge nowadays.
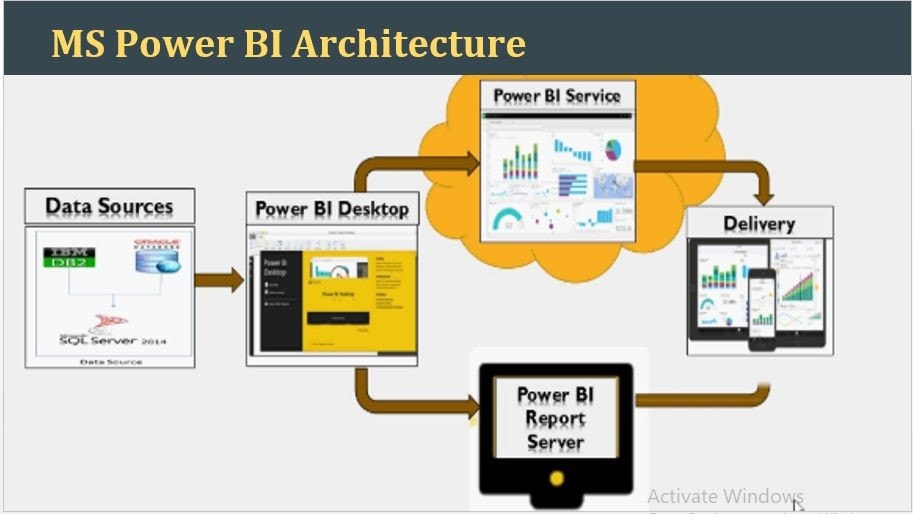
Power BI Architecture
Components:-
- Power BI Desktop
- Power BI Service
- Power BI Mobile Apps
- On-Premises Gateway
- Power BI Report Server
- Power BI Embedded
Why Power BI and What can be done Using this?
Power BI Desktop is the tool which we use to develop all the reports and Dashboard, By Using this tool all the below tasks we can perform.
- To Connect with Multiple Data sources.
- To Create a Proper Data Model for Analysis Purpose using Multiple Data Sources(List of Different Sources has given below).
- To Perform Transformations for the Dataset based on the requirements.
- To Create Rich Visualizations.
- To create Calculated Fields for the information which is not available in the dataset.
- To have better Interactivity with the Reports and Dashboards.
- Easy To Learn, No coding is required.
- For Better Sharing the workings done among Organization.
- Cost wise Very Less Compared to Other Tools.
- It has better integrity with all the products from Microsoft Ex:-AZure, SSRS, SSIS, SSAS, SQL Server E.t.c
List of Different Data Sources Which can connect with Power BI Desktop
By Using Power BI Desktop We can connect all the databases which ever mentioned in the below List.

The Power BI(Microsoft) is frequently increasing the data sources which are available across to Power BI tool.
Following types of data sources
- All
- File
- Data Base
- Power BI
- Azure
- Online Service’s
- Others
The File type data sources provide the following data connections:
- Excel
- Text/CSV
- XML
- JSON
- Folder
- SharePoint Folder
The Data Base category provides the following data connections:
- Oracle Data Base
- SQL Server Data Base
- Access Data Base
- SQL Server Analysis Services Data Base
- IBM DB2 Data Base
- IBM Informix Data Base (Beta)
- IBM Netezza
- MySQL Data Base
- PostgreSQL Data Base
- Sybase Data Base
- Teradata Data Base
- SAP HANA Data Base
- SAP Business Warehouse Application Server
- SAP Business Warehouse Message Server
- Amazon Redshift
- Impala
- Google BigQuery
- Vertica
- Snowflake
- EssBase
- AtScale cubes (Beta)
- BI Connector
- Dremio
- Exasol
- Indexima (Beta)
- InterSystems IRIS (Beta)
- Jethro (Beta)
- Kyligence Enterprise (Beta)
- MarkLogic (Beta)
Most database connectors require that we need to enable them by selecting File > Options and settings > Options then selecting Preview Features and enabling the connector.
The Online Services category provides the following data connections:
- Adobe Analytics
- appFigures (Beta)
- Azure DevOps (Beta)
- Azure DevOps Server (Beta)
- Common Data Service
- Data. World – Get Dataset (Beta)
- Dynamics NAV
- Emigo Data Source (Beta)
- Entersoft Business Suite (Beta)
- GitHub (Beta)
- Google Analytics
- Industrial App Store
- Intune Data Warehouse (Beta)
- MailChimp (Beta)
- Marketo (Beta)
- Microsoft Azure Consumption Insights (Beta)
- Microsoft Exchange Online
- Microsoft Graph Security (Beta)
- Planview Projectplace (Beta)
- Mixpanel (Beta)
- Planview Enterprise One – CMT (Beta)
- Planview Enterprise One – PRM (Beta)
- Quick Base
- QuickBooks Online (Beta)
- Salesforce Objects
- Salesforce Reports
- SharePoint Online List
- Smartsheet
- SparkPost (Beta)
- Stripe (Beta)
- SweetIQ (Beta)
- TeamDesk (Beta)
- Twilio (Beta)
- tyGraph (Beta)
- Webtrends (Beta)
- Zendesk (Beta)
The Other type of data sources provides the following types of data connections:
- Active Directory
- BI360 – Budgeting & Financial Reporting (Beta)
- Blank Query
- Denado
- Hadoop File (HDFS)
- Information Grid (Beta)
- Microsoft Exchange
- OData Feed
- ODBC
- OLE DB
- Paxata
- Python script
- QubolePresto (Beta)
- R Script
- Roamler (Beta)
- SharePoint List
- Spark
- SurveyMonkey (Beta)
- Tenforce (Smart)List (Beta)
- Web Workforce Dimensions (Beta)
Power BI Service:-
Power BI service we also called as Power BI Online, Power BI Service is business analytics and Visualization service based on the cloud that enables anyone to Visualize and analyze with more efficiency and speed. It has been developed on the Microsoft Azure platform. This is the place where we upload all the reports and Dashboard which are built on Power BI Desktop.
Advantages:-
- It Integrates easily with an existing business environment allowing to adopt analytics and reporting capabilities.
- It helps to publish the reports and Dashboards whatever developers developed on the power Desktop
- It provides better access to security.
- It helps to automate refreshes and publish the reports.
- No memory and Speed Constraints, since it is built on Cloud.
- For this technical expertise employees are not mandatory.
- It Supports Powerful Natural language query.
- It helps to provide the different levels(on Report level and Row level) of security to the data source, reports and Dashboards.
Power BI Report Server:-
Power BI Report Server performs all the tasks which are performed by the PowerBI Service.The main difference between these two servers is the server where it is located, Basically PowerBI service is built on Cloud(Microsoft Azure) and this hosts by a different company not by Client.
But in Power BI report server is based in Client Location, when the clients don’t want to share the data with any other company maintaining Cloud-based servers.
Advantages:-
For better data Security
Disadvantages:-
- Cost is high
- Technically Skilled employees required.
- Server infrastructure is required.
- Maintainance is required.
Power BI Report / Dashboard Viewing:-
Once the developers developed the reports and Dashboards which are involved in multiple data sources, multiple new columns, calculations all will be uploaded into PowerBI Service / PowerBI Report Server, once it is uploaded it will give the one URL, Using this URL customer can access the Reports/Dashboards using web by using the Desktop / Mobile phone / TABlet Etc.
Especially if the consumer wants to view the reports and Dashboards then they have to get install his/her mobile by PowerBI Mobile app. Using PowerBI Mobile app customer can’t interact with the report, only he can view the reports and Dashboards.
Power BI Vs other BI Tools
After Microsoft has been launched its powerful Power BI tool. The power BI concurred the BI industry in a limited time span. Now it is choice for many of forwarding thinking organizations.
It is a best powerful tool for the organizations that use multiple and different sources into the order to develop meaningful insights. It contains extraordinary interactive and rich visualization with true self-defined service analytics capabilities. Using these options helps the business to see the same kind of data from multiple viewpoints. These reports/Dashboards can be created by anybody in the organization without the help of IT professionals.
Advantages of Power BI
- It is one of the cheapest BI Tools in the market.]
- Extraordinary visualizations of the dashboard is the top in the market and are being continuously updated.
- If you’re an Excel user, you will be attracted by Power BI features, because the tool used is very similar to Excel.
- Power BI Supports various types of sources and it has in analytics memory, which helps in deriving trends.
Customers always mandate business insights and they want it now. Power BI helps you by setting importance that can be easily deployed and we are able to concentrate only on the measures that matter to your business. Create personalized dashboards, charts, reports and graphs that specifically match our needs and by using data that really matters. Centralizing all dashboard views from one place is a distinct possibility.
Predictive forecasting as the firearm of Power BI
Power BI educates the analytics feature several notching up by providing predictive forecasting. It is dynamic in today’s business situations where businesses need to be informed at all times about the multiple opportunities and risks that are skulking. We can easily visualize what the future holds for our company in terms of business sales and performance too. All this is effortlessly delivered. Thanks to Power View which offers charts and reports for predictive analysis. Power BI can be accessed by any devices like computers, mobile or tablet devices
Natural Language Processing (NLP) prosperous in this tool
Power BI has an additional feature called Natural Language Processing (NLP) layer. This makes it absolutely simple to query for any information required by using natural human language. You take your data, organized machine learning on it, build it into an application and convert it into hardcore business intelligence.
Power BI Data Modeling
Introduction:
Power BI is a reporting tool which allows to connect multiple tables from various sources and relationship created to model the data as per needs.
Various custom calculations can be created to explore the various segments of the data, and these measures are used in visualization for modeling.
Managing Data Relationship
Power BI allows setting the relationship between tables or elements. For a diagrammatic view of data, have a look into Relationship View
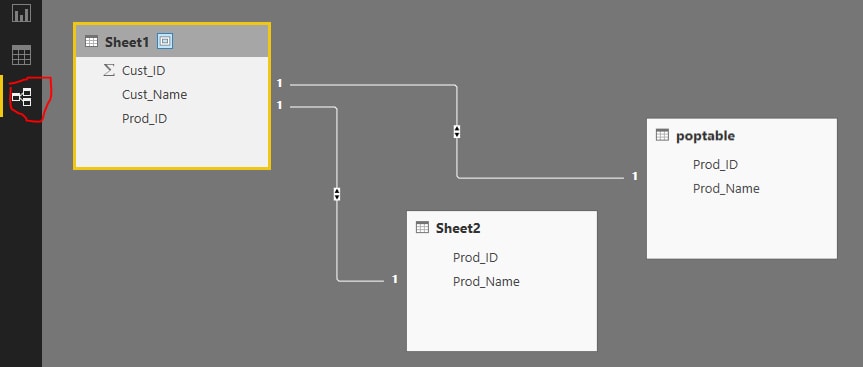
It’s easy to view the tables and its columns and lines between them to see the relationship.
To remove a relationship, right click on it and click on delete
Hiding a table or column
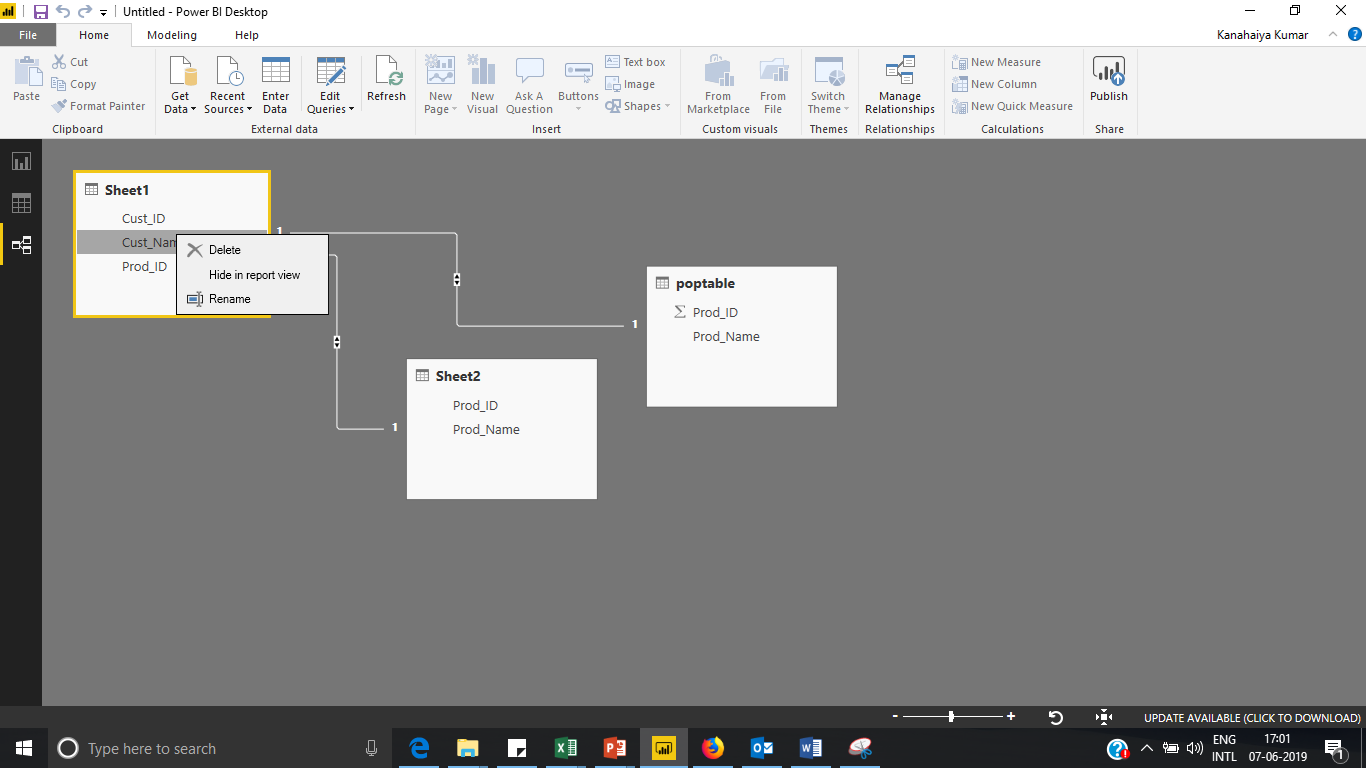
Detailed view of data relationship, select manage relationship under home tab.

Relationship in a many to many cardinalities allows joining tables
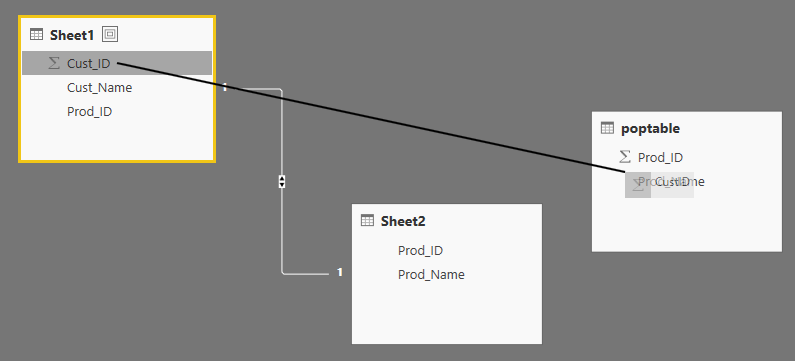
Calculated Columns
Calculated columns in Power BI can be created by adding two or more elements of existing data. It also allows to apply calculation on the existing column for new metric or add two columns to create one new column
It is also possible to create a calculated column to establish a relationship between tables and also used to set up a relationship between two tables
Below is created a column using DAX (Data Analysis Expression) formula
Prod_C = RIGHT(poptable[Prod_ID],3)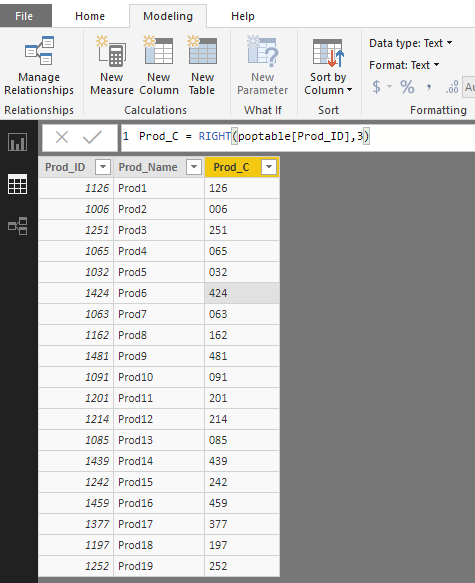
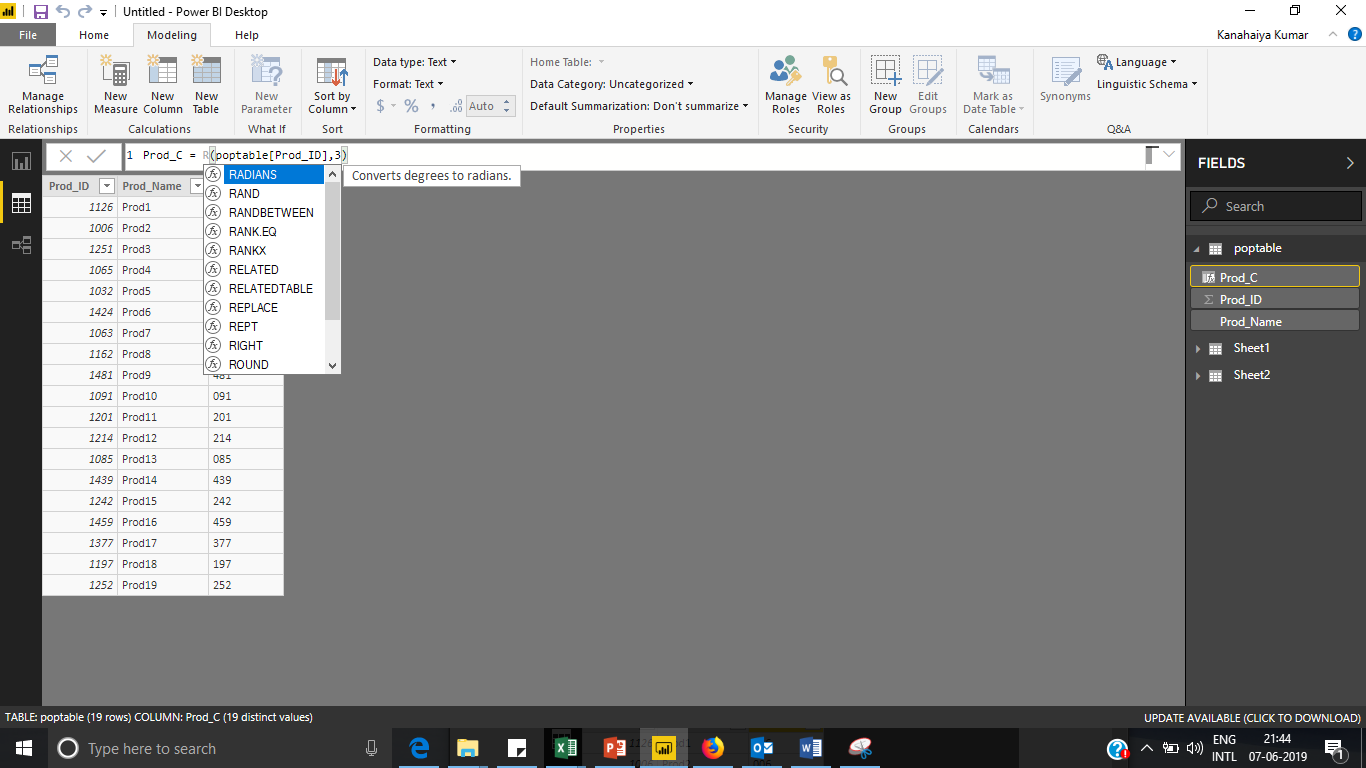
Below image shows many formula which can be used for creating calculated columns
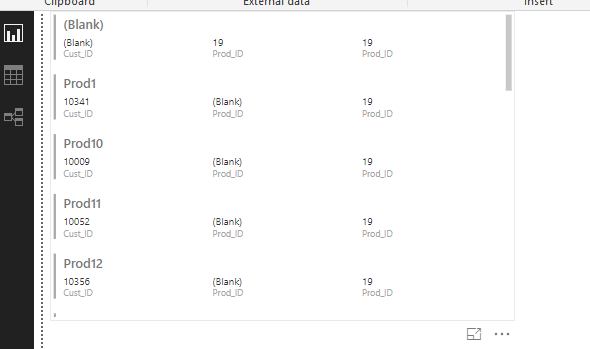
Creating Calculated Tables
To create a calculated table for data modeling in Power BI, click on the new table under the Modeling tab
DAX is used create a new table and below is created a new table which could be find in fields pane of model.
Table_Cust = DISTINCT(poptable[Prod_ID])
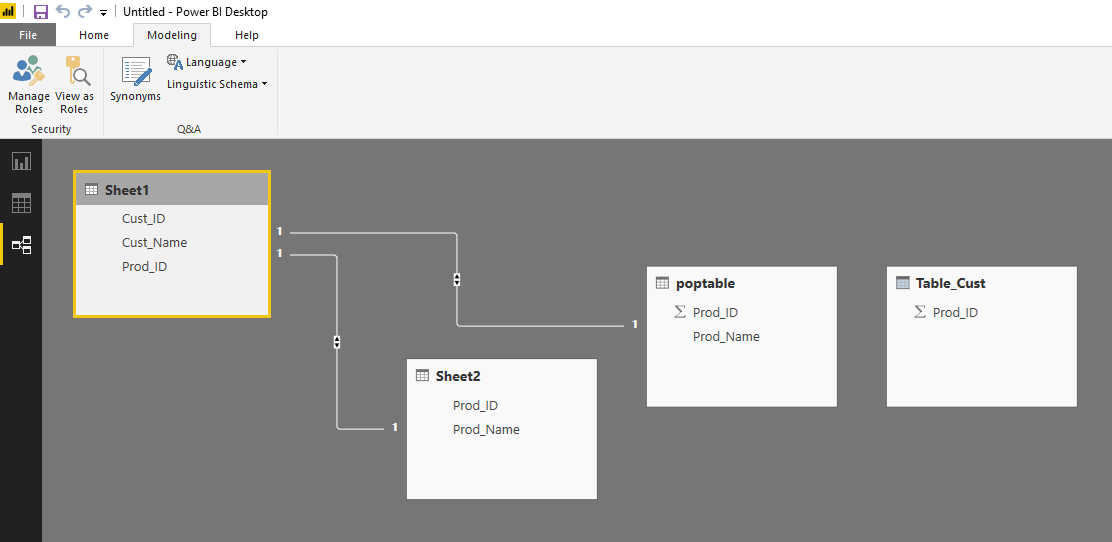
In the above example of creating a new table using DAX, it returns one column table with unique values in a column in another table.
- The diagrammatic view shows newly created table Table_Cust and same could be observed in the fields section too
- When new column and table created as per requirements, it can be used in the report tab in Power BI
- To see the report, click on the Report tab and have a look into calculated columns and calculated table in the report view.
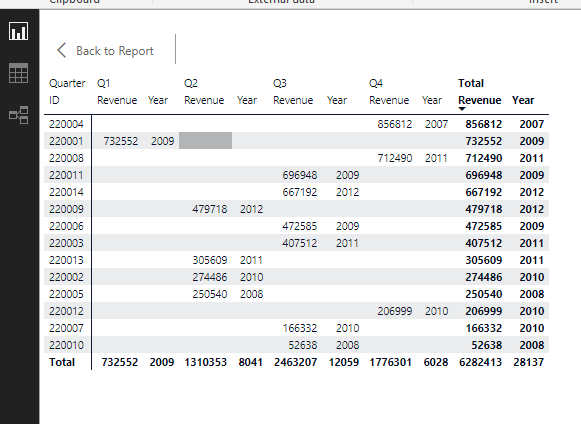
Exploring Time-Based Data
Using Power BI to explore and analyze time-based data is quite easy and drill through visualization to get the interactive reports.`
Below is time-based data which we are imported to power BI
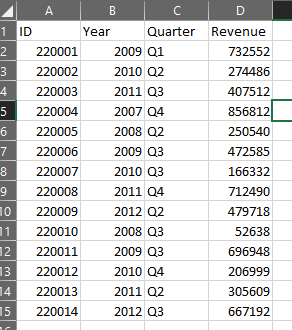
After importing the data, it takes the next level by default
Waterfall chart

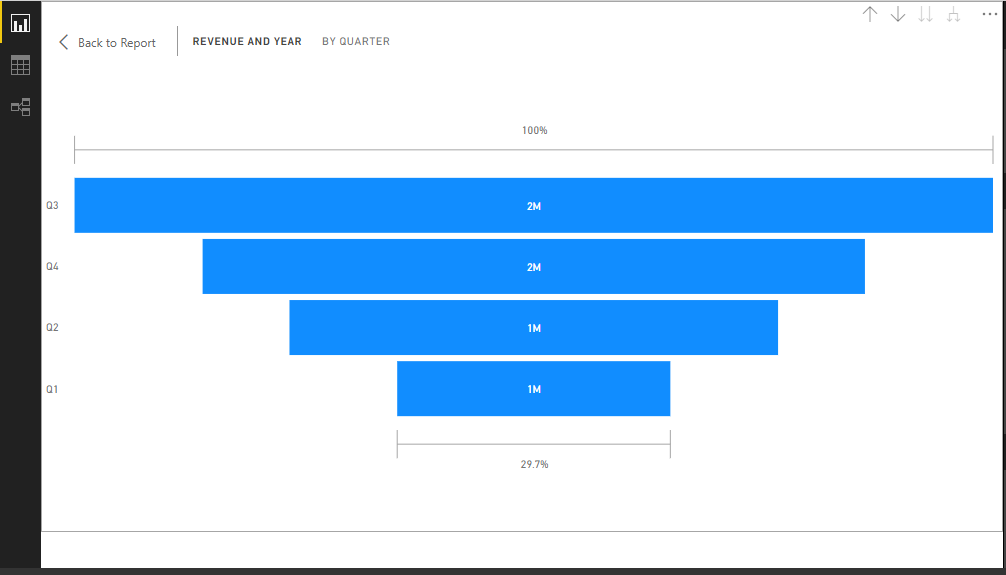
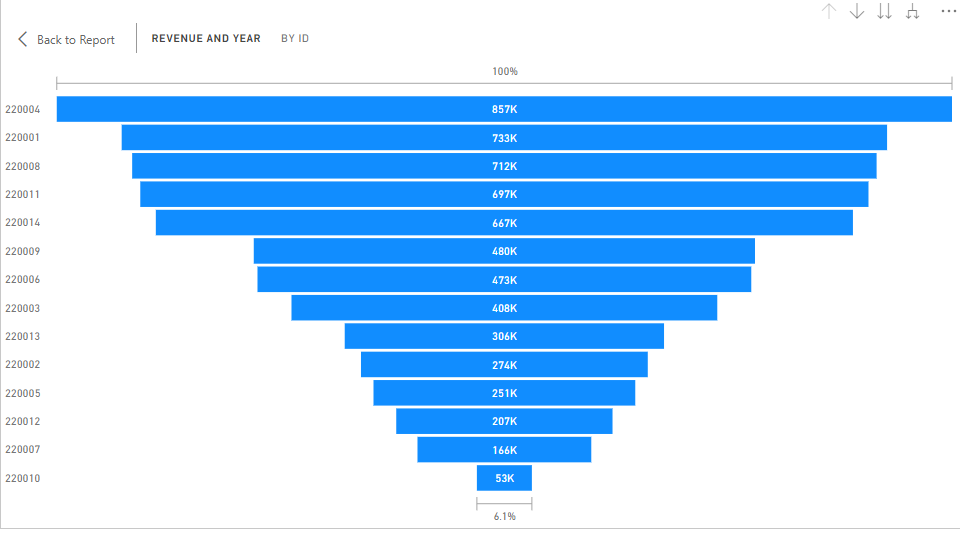
Funnel Chart
Power BI – Dashboard Options
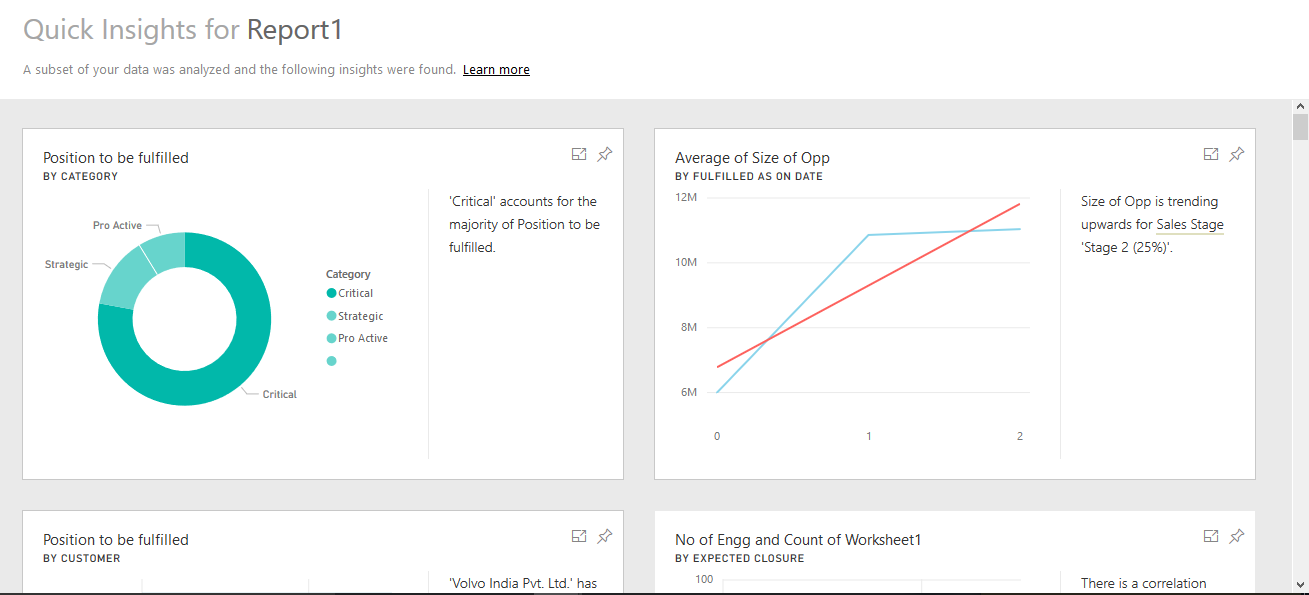
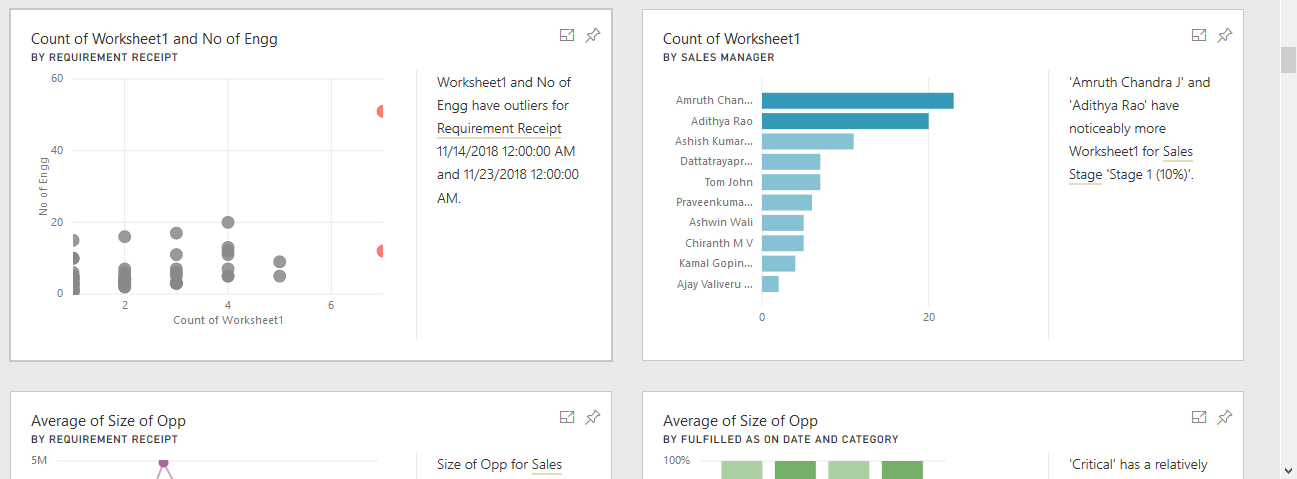
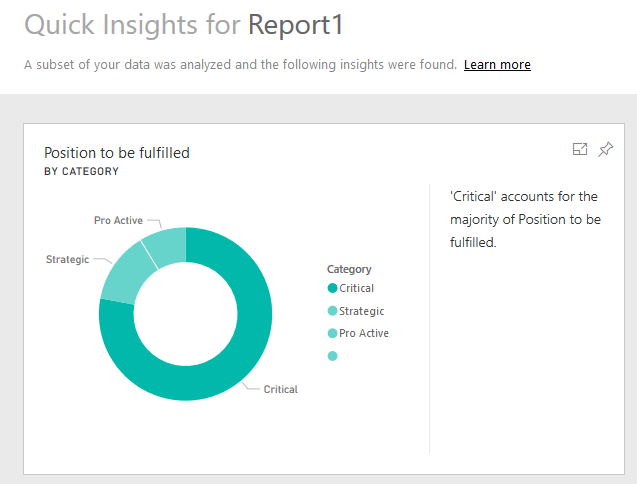
Power BI has a lot of options to explore datasets, you can simply explore the dashboard or BI Report by navigating datasets section. When you click on get insights, by default all the reports and charts will be prepared, and you can arrange it as per needs.
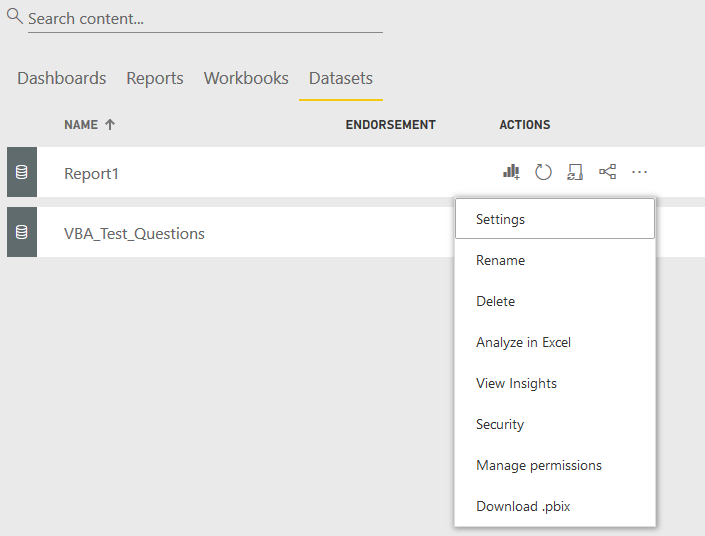
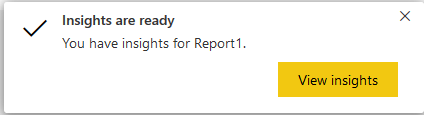
When you click on view insights option then it will show you chart representations of your data, While publishing a report to power BI services, you can find Get Quick Insights
Dashboard
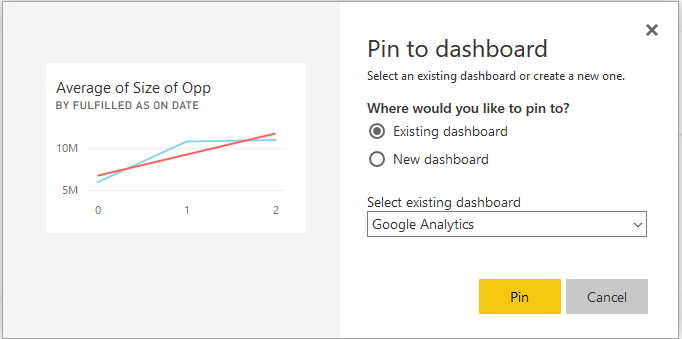
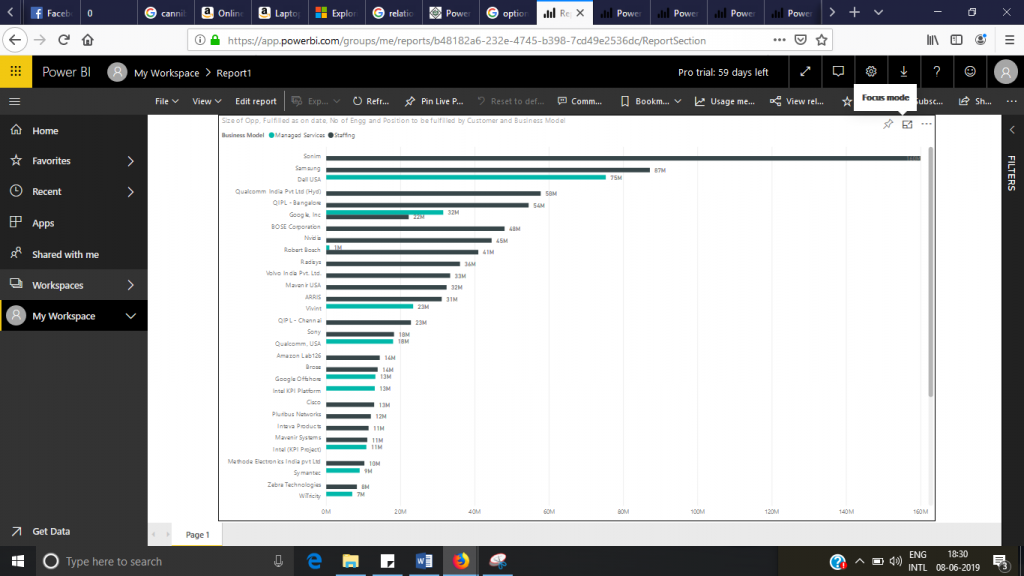
Power BI allows you to create a dashboard by just pinning the visualization from reports which are published using Power BI Desktop.
In Power BI, there is an option to pin and focus mode visual and could be found at top of the chart.
When you click on pin then a pop window appears which allows you to select respective dashboard to select where you want to pin the visuals.
After selecting dashboard and click on Pin, it would be pinned to particular dashboard and can be viewed at my workspace dashboard section
Sharing
After publishing BI report to Power BI Service, it can be shared among other users in your organization.
After clicking on the share button a pop window appears which allows you to share the dashboard other users in your organization. Sharing feature is available with Power BI pro which is also available 60 days free trial version
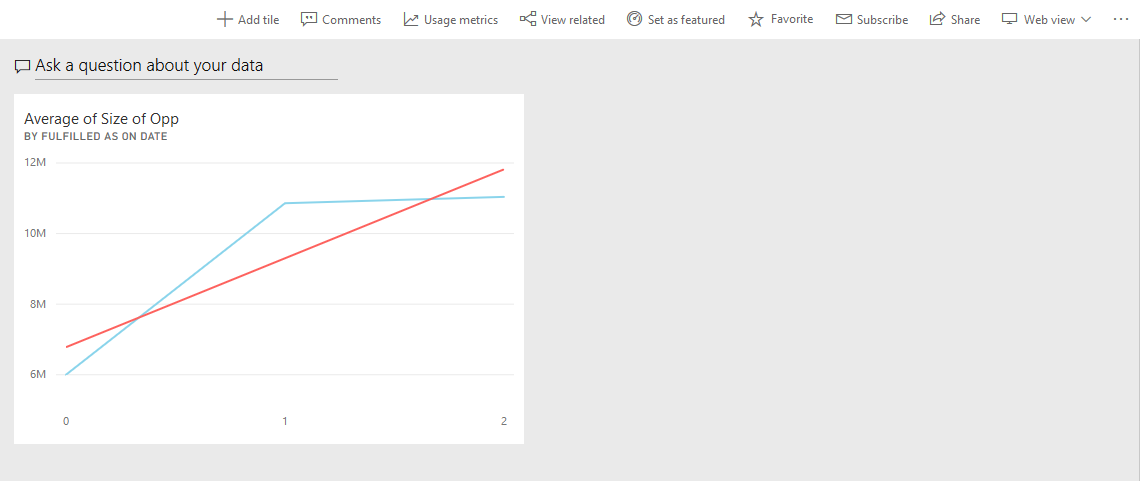
Tiles
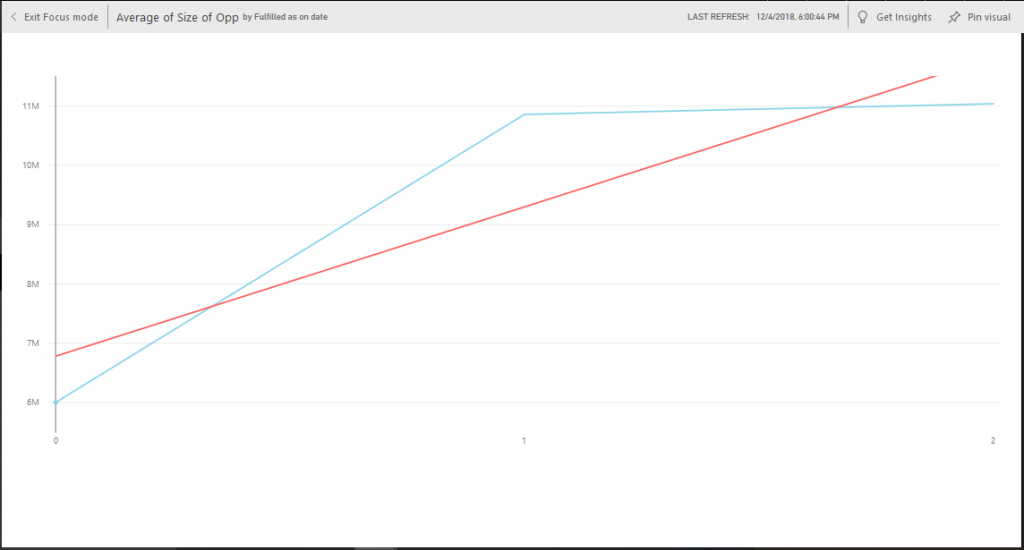
There is more option in the dashboard, in that focus mode and many other options are available. Focus Mode is used for better viewing purpose when you have multiple data values in visualizations.
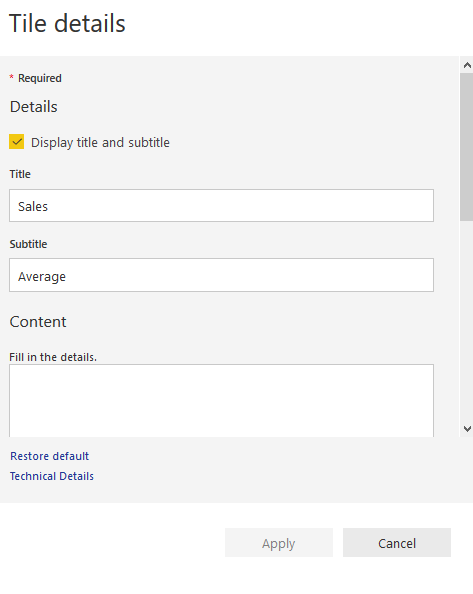
There is an option to add tiles and which allows changing tile’s name, subtitle, creating a custom link for the dashboard, etc.
Tile Details
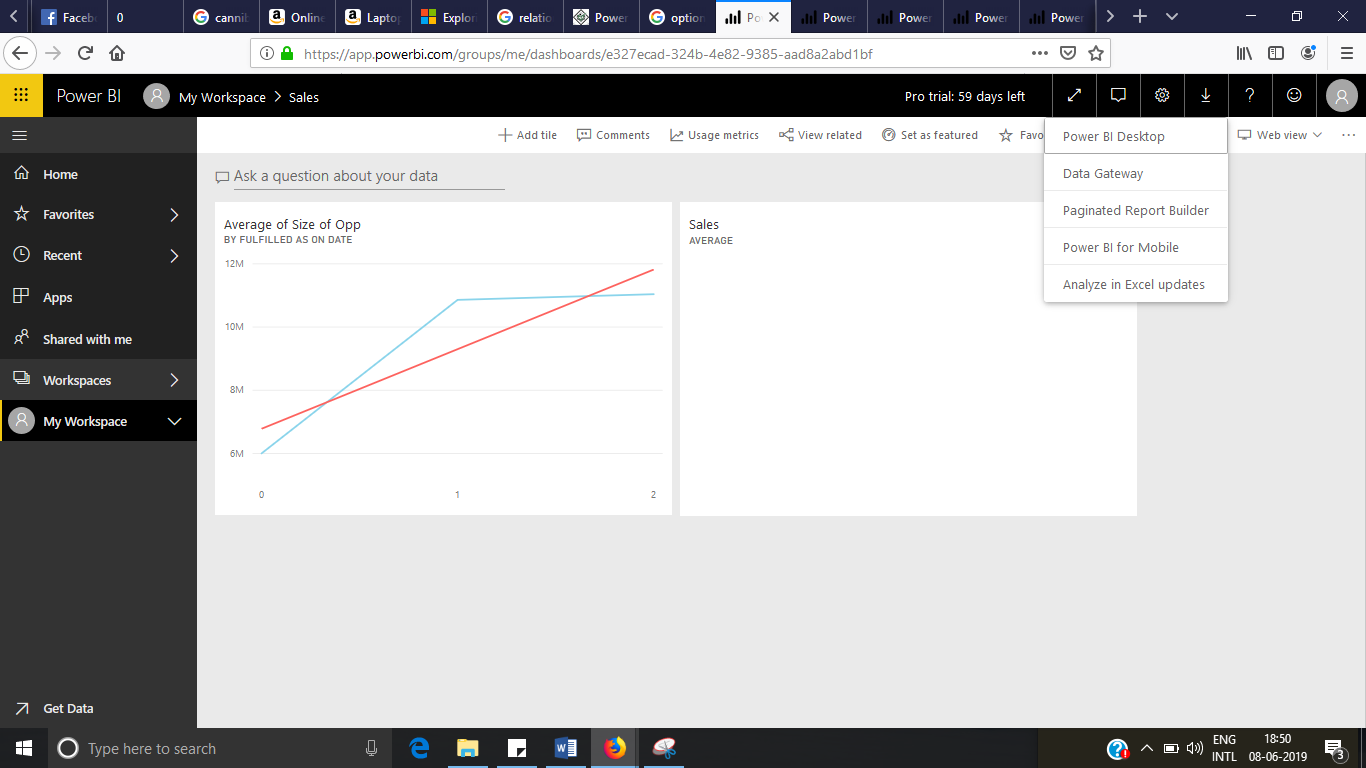
 Data Gateway
Data gateway allows you to keep your data fresh by connecting on-premises data sources without necessarily moving the data.It can be downloaded by click on the top right corner of the power BI screen.
After downloading and installation, there is two options
- On-premises data gateway
- Personal gateway (power BI only)
After login to data gateway service, it allows you to enable automatic updates by navigating to schedule, refresh, and frequency of the schedule.
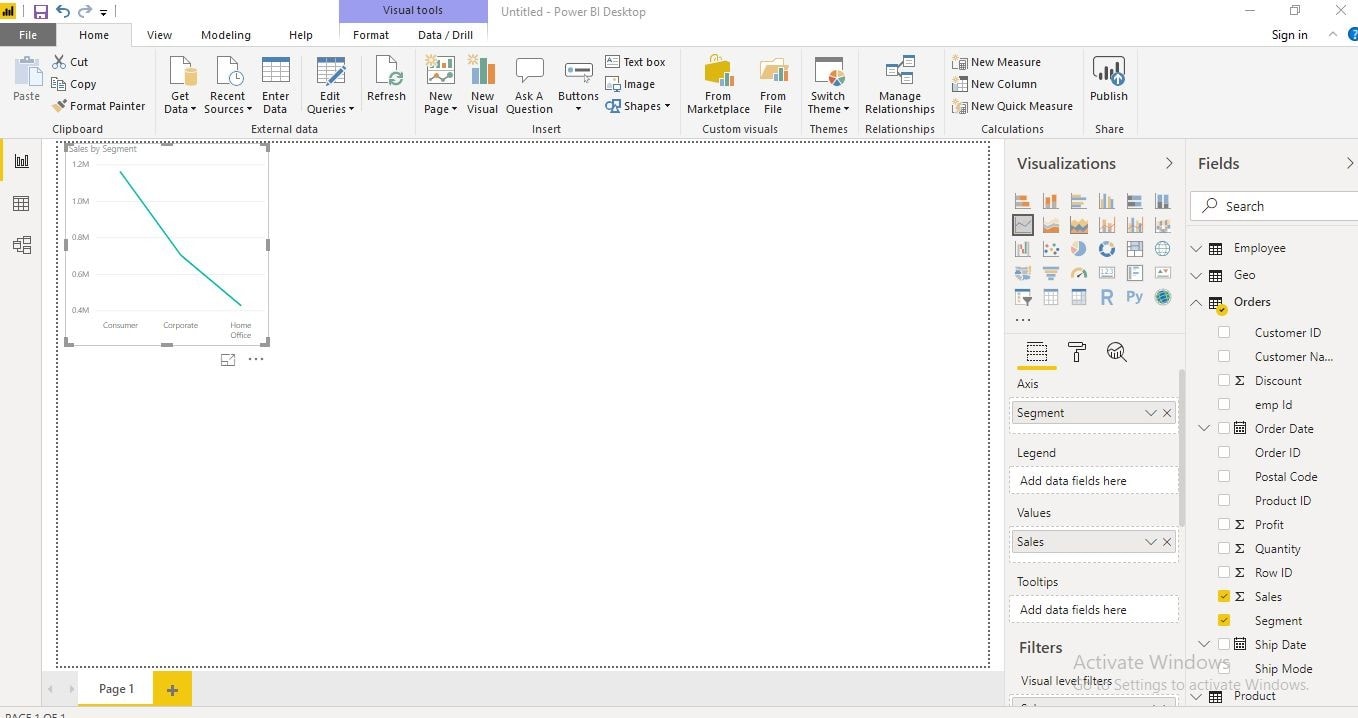
Power BI Data Visualization
- Power BI is a business intelligence tool developed by the Microsoft Corporation which helps users to create interactive visualization.
- Power BI contains various default data visualization options such as bar charts, pie charts, maps, waterfalls, funnels, gauges, and many others.
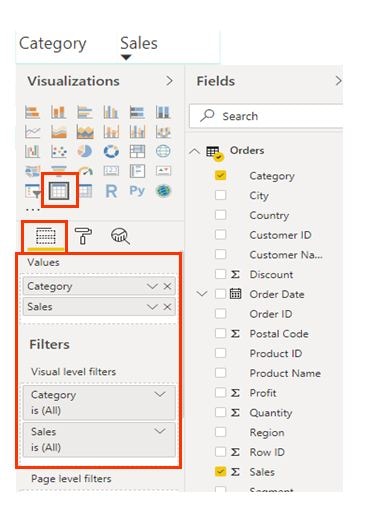
- In Power BI, we can create visualizations in two ways.
- Adding the chart to the Report pane first, and then selecting the field names.
- Adding the field names and then choosing the charts next.
- When we use any of the options above, by default Table type visualization will be created
Example
Let’s take, I have taken the Superstore (Excel file) data and I want to see the Total Sales by Category.
Step 1: Connect your data source to the Power BI.
Step 2: You see the three tabs
- Report: Where we create the visualizations.
- Data: Where we see our data and can add calculations.
- Model: Where we do data modeling.
Step 3: Create the required calculation and visualization.
Step 4: Publish the Dashboard.
Power BI Data Visualization – Table
 Note: We can use other visualizations by selecting another viz.
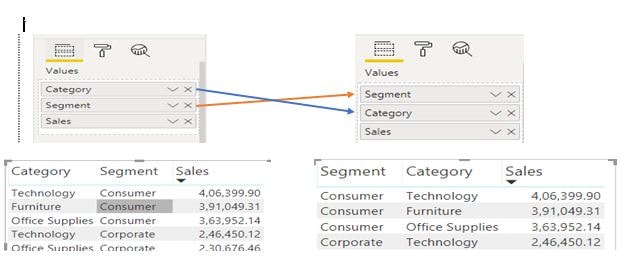
We can change the order of columns under Fields.
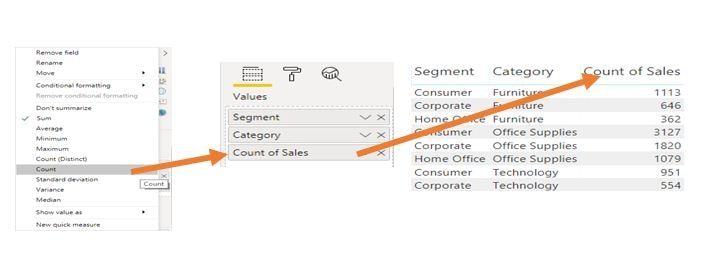
Power BI Data Visualization – Changing values
We can apply different aggregation functions on the numerical values. To change, click on the Measure field and choose an aggregation function.
Power BI Data Visualization – Matrix Table
We have another type of Table called Matrix Table which provides more features like columns, auto-sizing, etc.,

Power BI Data Visualization – Format Visualization
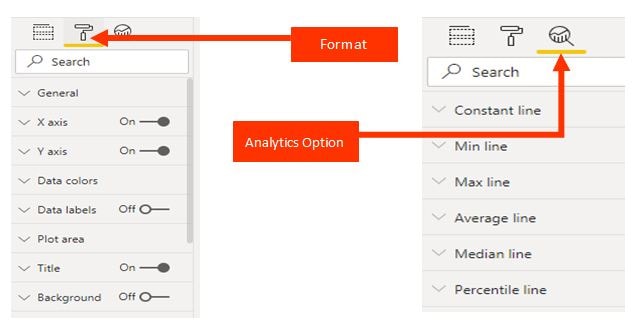
Power BI – Types of Charts
- Area Chart
- Bar Chart
- Cluster Column Charts
- Combo Charts
- Doughnut Chart
- Funnel Chart
- Gauge Chart
- Line Chart
- Pie Charts
- Scatter Charts
- Waterfall Charts
Power BI- Excel Integration
This topic will explain to you the ways that Power BI and Excel interact with each other.
Analyze Power BI Dataset in Excel:
Power BI dataset available in Power BI online services is used by Excel user to analyze. The connection between Excel and Power BI dataset would be live. Whenever the user refreshes the excel file, most recent data would be fetched from Power BI online service. Please refer video Analyse Power BI Dataset into Excel for detailed analysis.
Power BI publisher adds in:
Power BI Publisher for Excel provides two ways integration of Excel and Power BI. Power BI Publisher provides the functionality to pin a range of cell into Power BI dashboard. You can connect to Power BI dataset and slice and dice it. Please refer video Power BI Publisher Add in for detailed analysis
Import Excel into Power BI service:
In real time scenario, we rarely import Excel workbook into a service. However, this option would be useful, when you want to share Excel workbook and Power BI report both. We have two option to open excel workbook from Power BI Online service Excel Online Local version of Excel. Please refer Video Import Excel into Power BI Service for detailed analysis.
Import Excel into Power BI Desktop:
You can Import an Excel into Power BI work desktop. When you import exceed expectations exercise manual, whole model including tables, relationship and counts will be brought into Power BI work desktop. It is exceptionally valuable when you have existing force rotate model into exceed expectations. If you don’t mind allude video Import Excel into Power BI work desktop for point by point investigation.
Power BI- Sharing and Dashboards
This topic will explain to you the interactive method of sharing the dashboard to other users from Power BI online services. Below are the sharing methods
Basic Sharing:
In this method of sharing we open a dashboard or report and click on the share button, and then share with another user by providing the user mail id. A user using a shared report will be able to reshare but not able to edit the content of the report. A shared report can be seen in shared with me a section of a user. Please refer video Basic sharing for a detailed explanation.
Workspace:
Basic sharing method has a limitation when it comes to sharing multiple report or dashboard at once. Workspace method comes handy when multiple reports are shared at once. In this method you just need to give access to user and user would be able to see all reports dashboard workbooks present in particular workspace. Workspace method provides two levels of access one is read-only and other is edit. Please refer video Workspace for a detailed explanation.
Power BI apps:
Power BI App is the answer for different condition approach. With Power BI App, your improvement condition workspace and client condition App are separated from one another. Creating an App for a workspace is very simple. Clients can without much of a stretch access it through the Apps segment of their Power BI account. Please refer video Power BI apps for a detailed explanation.
Publish to Web:
This method can be used when your report does not consist of sensitive or confidential data. Publish to web way, gives you an embed code which you can use in any web pages to embed the Power BI report in it. The embedded content through this way would be available for anyone who has access to that page. Please refer video Publish to the web for detailed analysis.
DAX Basics in Power BI
What is DAX?
Data Analysis Expression known as DAX is basically used for creating custom formulae in Power BI. It helps you to create different types of mathematical calculations that help to do an analysis of the data in a proper manner. It provides the functionality of creating custom measures and columns that help in aggregating the data as well as in manipulating the information. DAX is a generalized form of M language. The functions used in the DAX measures or column generally run an M Language query in the background.
Examples:
CALCULATE =
VAR A= 12*SUMX (COLUMN 1)
VAR B= 100/ VAR A
RETURN (VAR B)
Functions of DAX
Depending upon the usage, there are various types of DAX offered by Power BI:
- Date
- Logical
- Aggregate
- Text
- Counting
- Information
Date
The Date DAX is used for recognizing the date and time flow in the data shown in the visuals. It helps to sort the data using measure created for Date column. The date dax are of different types depending upon the requirement.
Example:
FIRST DATE: It helps to find the first value of the date.
Logical
The Logical DAX is created for doing the calculation of complex formula which can be arithmetic or any condition based.
Example:
IFERROR(2>3,True,False)
Aggregate
The Aggregation DAX helps to do the aggregation of columns based upon the requirement. If you want to calculate average on the value of the column or row level average, then this DAX provides this functionality
Example:
AVERAGE(Column_A)
Text
The Text DAX helps to do string operations in Power BI. The functionality to change the string in the column to upper case or lower case or to do concatenation is provided in the text dax.
Example:
CONCATENATE(“Column_A” + “Column_B”)
Counting
This DAX helps to count the values in a column for a specific condition. If you want to count the number of values greater than 5 in a table, then this DAX would help you to do so.
Example:
COUNT(Column_A): This would help you to count the numbers in a column
Information
If you want to provide some textual information in the report such as disclaimer then this DAX helps you to get that functionality in the report.
Example:
“This report is only intended to use for business process. The ABC company holds the copyright of the information provided in this report.”
Power BI Administration Role
The Power BI admin portal has usage metrics, access to the Microsoft 365 admin centre, and settings. The Global Admin users will be having full admin portal access in Office 365.
Power BI Admin Portal
To get access to the Power BI admin portal, you should be a Global Admin of Office 365 or Azure Active Directory, or assigned the Power BI service administrator role.
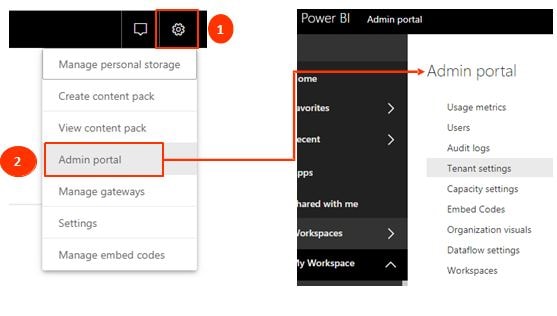
Follow the steps below for Power BI service.
- Open https://app.powerbi.com/
- Settings > Admin Portal
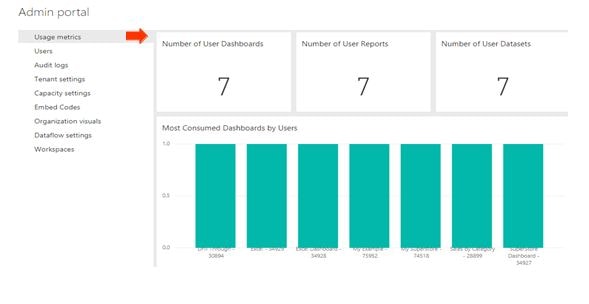
Usage metrics – enables us to monitor Power BI usage for the organization. It also provides the ability to see which users, and groups, are the most active within Power BI.
Users – In the Microsoft 365 admin center we manage the Power BI admins, groups, users.

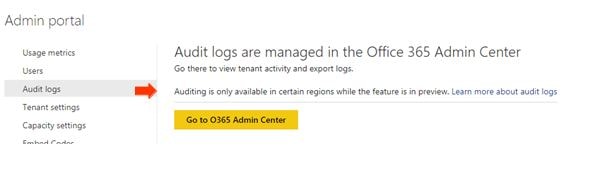
Audit Logs – In the Office 365 Security & Compliance center we can manage the Power BI audit logs .
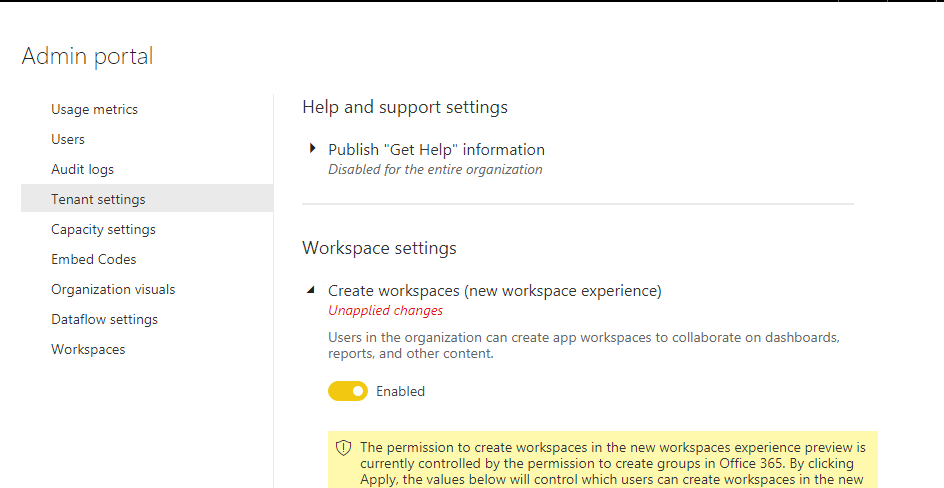
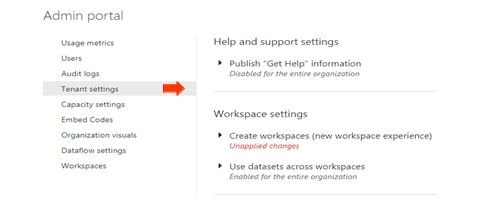
Tenant Settings – The Tenant settings tab enables the control over the features that are made available to the organization.

 +1 201-949-7520
 +91-9707 240 250