Tableau Vs Excel
Tableau Vs Excel
Tableau and Excel are like cousins, they are not really the same tools but has many great things in common. Let’s see what are their key features, strengths and differences are.

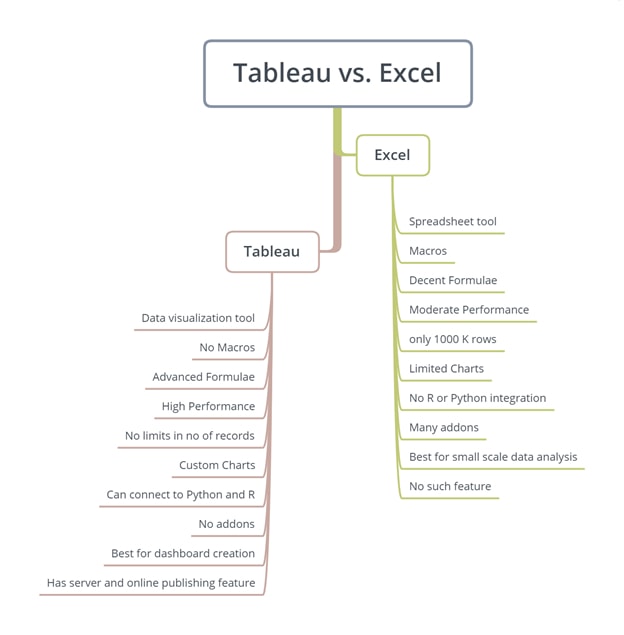
The above image helps us to understand them well.
MS Excel is present in the IT world for very long time. It is the number one app for Spreadsheet analysis. Recently turned into automation and chart making software.
Tableau is the new teenager in town who is well known for its specialization, the data visualization job. It uses Excel, database, cloud as input and creates dynamic, interactive and visually appealing dashboards.
Excel’s VBA and macro helps a lot of developers to automate their data analysis and data manipulation. Tableau does not have such feature.
Excel’s formulae are limited yet powerful. Tableau has few formulae borrowed from Excel and other SQL tools. Tableau’s formulae look closely similar to excel but has much more formulae and functions.
Tableau is popular for it performance. It is applicable for the output, formulae, export, import, etc. Excel is comparatively slower when it comes large data. Speaking of which, Excel supports only 1000 K rows. But Tableau has no limitations and has greater performance.
Tableau has a wide range of in built charts and it can be customized to create lots of custom and cool charts like Sankey chart, Sun burst chart, polar chart, etc. Excel’s charts are simple and limited.
Tableau can connect to R, Python and Matlab. Many statistics, data manipulation and various functions can be executed there. Excel does not natively connect to them.
Excel has lots of addons. It can be powerpivot, data reshaper, etc. Tableau has no addons yet.
Tableau’s dashboards are well known for its powerful and interactive nature. We could easily use one chart as a filter to another. Drilldown to another dashboard. Do lots of cool stuffs with it. Excel’s dashboards are simple and not as powerful as Tableau.
Tableau uses windows application called Tableau Desktop. Charts, dashboards are created here. Tableau Dashboards can be published to Tableau server or Tableau Online. It is so much customizable and automated like custom permissions, refresh scheduling, email subscriptions , etc.
Excel doesnot have a real server part. MS sharepoint can be considered as Server part. But still it doesnot have as many features as Tableau Server or Tableau Online.
There are many similarities and differences between Tableau and Excel. But these are the most important ones. You could see more similarities like Excel Pivot table and Tableau Chart creation, few similar formulae, slicer and filters, formatting, dual axis charts, etc. Differences in highlight feature, URL actions, containers, mobile layouts, export modes, etc.


 +1 201-949-7520
 +91-9707 240 250