
Data Science Tutorial
Data Science Tutorial for Beginners
In this tutorial, we will learn about data science in the easiest and versatile way. At the end of the course we will be able to uncover what is the meaning of data analysis, information and tools involved, data analysis models, what are the different business model instruments.
We will find the contrast between data analysis and Big Data. How Big Data is revolutionizing data analytics? Big Data is as simple as it sounds; big>small; the huge bulk of data which are produced every day. With the huge bulk of data, basic Microsoft tools couldn’t contain in itself everything under the sun. Tools had to get “BIG” as the data it involves. In this way, improvement of new tools turned into a need to manage Big Data. This prompted the introduction of tools such as Python, Hadoop, SAS etc.
You must have heard of Flipkart’s “Big Billion Days” and Amazon’s “The Great Indian Festival”. The huge bulk of orders and their processing could be problematic. To examine what are users preferences, which set of orders are more popular than any, data science is useful. They can be solved by utilizing normal regression techniques and algorithms. One can apply data science methods to it and discover trends about a particular industry. These regressions are useful for business sales and predicting long-term growth. We will not go too much mathematical. Let us uncover the complexity;
Let’s take the example of Flipkart and Amazon again if we want to As we can see there are 5 major types of regressions. But they are not limited as one can make their own regression methods. You will also be able to do that once you master data science. Out of all these, linear regression is the most widely used.
- predict trends for oncoming demands
- cart price optimization,
- inventory management
- categorize loyal customers
- provide the systematic shopping experience
Linear regression forecast a linear relationship between a single entity X and a quantitative response Y
Y = β0 + β1X + ε
where ε is a random error term, which is independent of X and has a mean 0
à β0, β1 are the model coefficients or parameters
à Example: X is a specific item for e.g. Iphone 8 and Y is sales
sales = β0 + β1 × Iphone + ε
àBy using data to get estimates β0, β1. Prediction for X = x is then given by
yˆ = βˆ0 + βˆ1x
Estimating the Coefficients
àUsed data: (x1, y1),…,(xn,yn)
àIn Advertising data set, n = 200 different sellers.
àGoal: Find βˆ0, βˆ1 such that yi ≈ βˆ0 + βˆ1xi , for all
i = 1, . . . , n
1. Regression Analysis by Simple/Multiple Linear Regression
- A relationship between Dependent (Output) variables and Independent (Input) variables
- Multiple Regression: More variables, or transformations/high order extensions of the same input
- Examples: Sales: Population density and number of customers
For multiple regression, a value must be greater than 1
The independent variable is x and the dependent variable is y, so we can establish a straight line also known as regression line.
It is characterized by an equation:
Y=a+b*X + e,
where a denotes intercept, b denotes slope of the line and e denotes the error term.
2. Methods used in Data Science
Data Science with Python
Python is the most popular programming languages and most often used in data analysis. Python is an open source, object-oriented language. The common myth is- “For becoming a data scientist, you need to have an excellent command over Python” which is so not true. Most of the bulky books on Python are for the general readers who want to sharpen their command on Python programming, But here, your intention is to use Python for ‘Data Sciences’.
Several libraries have made it simple for executing Python programs. Many of the functions and procedures are inbuilt. Most used are Panda and SciPy.
These are used for general purpose data analysis. You can select columns, load your data into data frames, filter for specific values, group by values, run functions (sum, mean, median, min, max, etc.), merge data frames and so on. You are able to create multi-dimensional data-tables. Fun fact is- you can’t do this with Python.
Using calculations with Panda is so cool and easy. Let’s try it out yourself
| x=5 >>> x 5 >> x+2 7 >> x-2 3 >> x*2 10 >>> x**2 25 > x%2 1 |
We have seen through the above example how by assigning a value to x, we can simply do addition, subtraction, multiplication, exponentiation, find the remainder and do division functions easily.
Python Library – Numpy
Characteristics of Numpy object:
- It has a fixed size, not like a list in python. If you try to change the size then it affects the original
- All the elements are the same data type(homogeneous)
- The main agenda of nd array is that it solves the advanced mathematical operation in less code compare with python built-in
Installing Numpy:
Syntax:
Using pip:
Pip install numpy
Using conda:
Conda install numpy
Basic Attributes of nd array:
Nd array has the following basic attributes,
- ndim – It gives the number of dimensions we used in the array
- shape – It tells about the dimension of an array. For example, the matrix consists of n row and m columns then the shape of the matrix is (n,m).
- size – It gives the total elements present in the array. It is nothing about the multiplication of shape
- dtype – It describes the data type of each element in the array
Example:
| Import numpy as np a=np.arange(9).reshape(3,3) a |
Output:
| Array([[0,1,2],[3,4,5], [6,7,8]]) a.shape() # describe about number of row and column Output: (3,3) a.ndim() # describe about the dimension Output: 2 a.size() # tell the total number of elements Output: 9 |
Array Creation:
The following example shows the way to create an array in numpy.
Example
| Import numpy as np Arr=np.array([7,8,9]) Arr |
Output:
| Array([7,8,9]) |
Data Science with Hadoop and SAS:
Hadoop is another open-source framework for storing data and running applications to provide complete solution from processing to visualization of the data. It provides huge storage for any kind of data, powerful processing power and helps in fastening processing of data to handle limitless concurrent tasks.
SAS, on the other hand is used for statistical analysis. It provides output in the form of tables, graphs, and as RTF, HTML and PDF documents from common spreadsheets and databases. Be warned that SAS can only be used if you are using SAS products. However, there are no restrictions as such with Hadoop.
Hence, we can conclude that data science is the combination of statistics and computation. In order to analyze a huge chunk of data, computational methods are required statistically. The digital revolution has spawned technology; the large and varied set of data could be processed through data sciences methods.
3. Data Science Confusion Matrix
Predictions from a classification problem can be summarized for understanding how well the model has made the predictions. The confusion matrix contains the number of correct and incorrect for each class for which the predictions are made.
For example lets image a classifier is helping us predict if a person is a male or female.
Let the model output be taken as 1 for female and 0 in any other case i.e we are modeling for the possibility of a person being female.
Thus lets assign a value of 1 in case of Female and a value of 0 in any other case (male)
- Female
- Except Female (Male)
Lets assume that when we get a person to be female we have a positive result and 0 otherwise.
Thus there are four possible outcomes in this case
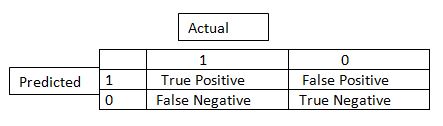
From the above table we see the following possible combinations.
Actual, Predicted
1,1- True Positive, indicates when a female is truly predicted as female
0,0- True Negative, indicates when a person not female is predicted to be not female
0,1- False positive, indicates when a person not female is predicted as female by the classifier
1,0- False Negative, indicates when a female person is wrongly classified as not female
Classification Report – It specifies some measures which are calculated from the results of confusion matrix helping in understanding how well a classification model is doing and how predictions of each class has fared.
Classification Accuracy = (TP+TN)/(TP+TN+FP+FN)
It is defined as the total correct predictions from a classifier by the total records.
Recall = TP/(TP+FN)
From the above confusion, matrix recall could be defined as the total number of correctly classified females divided by the total number of females in the sample.
Precision = TP/(TP+FP)
From the above-mentioned confusion, matrix precision can be defined as the total number of actual females to the total number of females predicted by the classifier
F Score = (2* Precision * Recall) / (Precision + Recall)
When for a classification algorithm both precision and recall are important we look at the F- Score instead which is the harmonic mean of Precision and recall.
4. Data Science Seaborn
Analysis of data using time series
Description: how time series is used to do forecasting of future. We will be taking dataset to analyse if it is stationary or not and also will learn how to make the dataset stationary
Domain : data science
Skills : statistics , data cleaning and restructuring
Credit card fraud detection
Description: analyse the data and conclude the percentage of consumer who had done fraud transaction. This information helps the bank in many different ways like to know the number of inactive users and aslo to identify the loop hole because of which this happens
Domain : data science and machine learning
Build decision tree and visualise the data
Description : understand the concepts and logic behind the classification algorithm. This product we will be starting everything from scratch and will not be using any built – in library for implementing decision tree. We instead try to create our own algorithm and understood the concepts.
Domain : data science and machine learning
5. Data Science Predictive Analytics
Predictive Analytics transform the information into important into value data Predictive Analytics utilizes information to decide the plausible result of an occasion or a probability of a circumstance happening.
Predictive Analytics holds an assortment of factual procedure from demonstrating, machine, learning, information mining and game hypothesis that break down present and historical realities to make expectation about future occasion.
There are three essential foundations of prescient examination
- Predictive demonstrating
- Decision Analysis and advancement
- Transaction profiling
Descriptive Analytics:
Descriptive analytics takes a gander at information and investigate past occasion for understanding as how to approach future occasions. It takes a gander at the past presentation and comprehends the exhibition by mining recorded information to comprehend the reason for progress or disappointment before. Practically all the administration detailing, for example, deals, advertising, tasks, and fund utilizes this kind of analytics. Enlightening model measures relationship in information in a manner that is frequently used to arrange clients or prospect into gatherings. Not at all like prescient model that spotlights on anticipating the conduct of single client, Descriptive examination distinguish various connections among client and item.
Prescriptive Analytics:
Prescriptive Analytics naturally combine huge information, scientific science, business principle, and AI to settle on forecast and after that proposes choice alternative to exploit the expectation. Prescriptive examination goes past anticipating future results by likewise recommending activity profit by the forecasts and demonstrating the leader the ramifications of every choice. Prescriptive Analytics not just envisions what will occur and when occur yet additionally why it will occur. Further, Prescriptive Analytics can recommend choice alternatives on the best way to exploit a future chance or moderate a future hazard and represent the ramifications of every choice option.For model, Prescriptive Analytics can profit social insurance key arranging by utilizing examination to use operational and use information joined with information of outside components, for example, financial information, populace demography and so on.
Diagnostic Analytics:
In this analysis, we for the most part utilize recorded information over other information to respond to any question or for the arrangement of any issue. We attempt to discover any reliance and example in the authentic information of the specific issue. For instance, organizations go for this analytics since it gives an extraordinary knowledge for an issue, and they likewise keep point by point data about there transfer generally information gathering may turn out individual for each issue and it will be very tedious.

 +1 201-949-7520
 +91-9707 240 250