
Tableau Tutorials
Connecting to Excel Files
Here we will show you, How to connect Tableau to Microsoft Excel Files and how to use excel sheets within Tableau with an example.
Steps involved
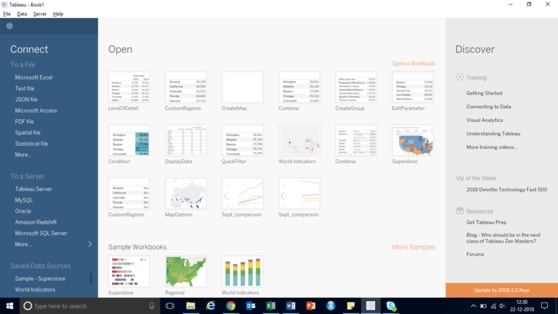
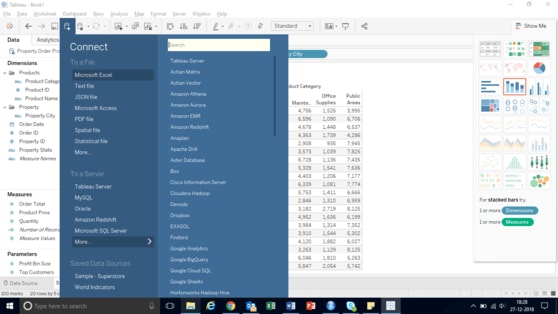
Start by clicking under the Connect section, select the Microsoft Excel Option
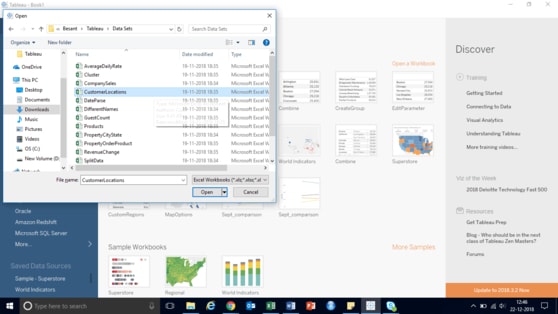
Once you selected the Microsoft Excel Option, a new window will be open, to select the Excel file from the local system.
Once you are done with this, below screenshot will be yours. Please go through the following options before you start creating the reports.
- Workbook: Excel File we selected from our local system.
- Excel Sheets: This is the Tables present in the tableau. We have a search bar here and it will be very useful for a large number of sheets files.
- Drag Sheets Here: You have to Drag the Table that you wanted to use to this Section.
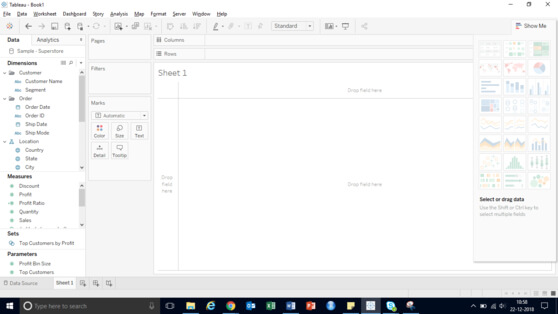
Once you are finished these steps, Click on the Sheet 1 to start design.
- Dimensions are basically columns with string data.
- Measures are basically Columns with Numeric data or Metric values.
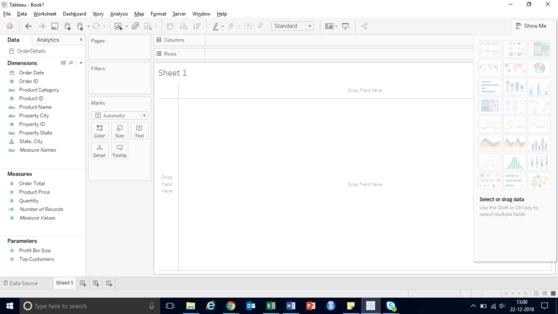
From the given above screenshot, you could have observed that We are only seeing the data present in the table.
Though we have other tables in our Excel file. If you want to add other tables, Click the back button on Top left corner and Join the other table which you wanted to process.
How to Join Data in Tableau
Tableau Joins plays a vital role in designing reports. Real-time design reports will be using database or data warehousing. So, we can’t generate reports using a single table (Based on business perspective).
For example, if you want to design a tableau report for Country wise sales, Country information will be in Geography or territory table & Sales will be the Sales table. In these situations we can use Tableau Joins to join Geography & Sales tables.
Tableau Joins Example
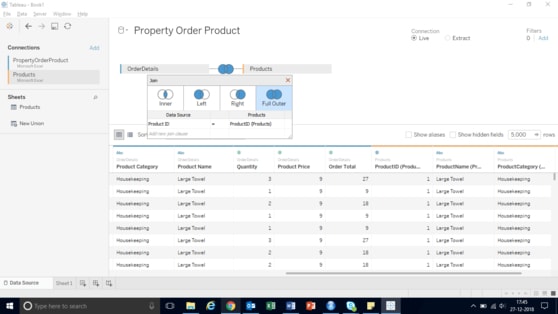
The following screenshot will show available Joins in tableau to join data
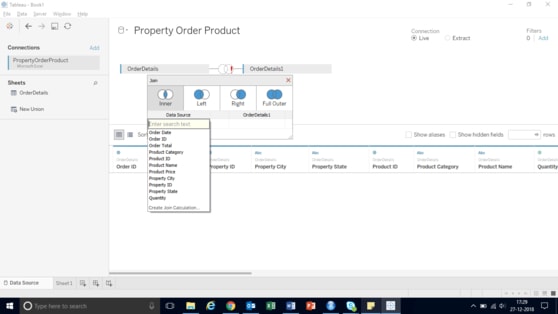
- Inner Join: It returns records (or rows) present in both tables If there is at least one match between columns.
- Left Join: It returns all records (or rows) present in Left table & matching rows from right table.
- Right Join: It returns all records (or rows) present in Right table & matching rows from Left table.
- Full Outer Join: It returns all records (or rows) present in both Left table & right table. All Unmatched rows will get NULL Values by default.
Joins in Tableau
First, Drag & drop Order details table as a left table
Next, Drag & drop Department table as the second table as shown below. By default, tableau performs Inner Join.
Tableau Inner Join
As we know, Product ID in Order details table & Product ID in Products table are key columns. But, by default, Tableau uses Product category as primary Key. Have a look in below screenshot.
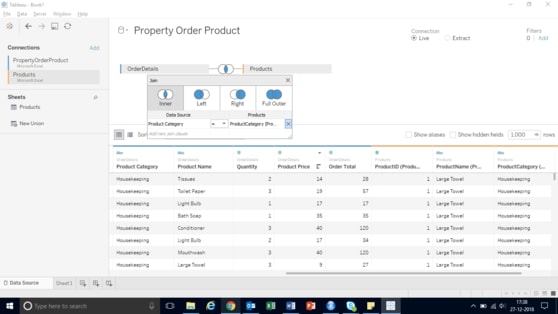
Now, Select Product Id column from Order details table & Product ID from Products Table as shown below.

Now, tables have been joined using Inner join idea.
Tableau Left Join
Let us change Join type from Inner Join to Left Join as shown below
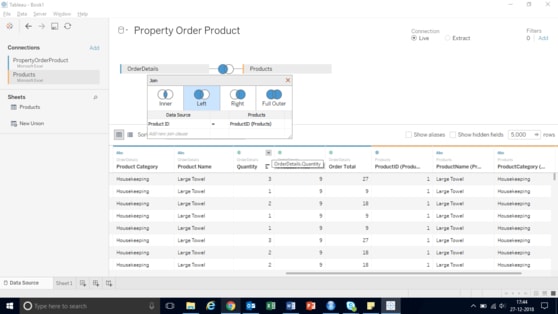
Tableau Right Join
Let us change Join type from Left Join to Right Join as shown below
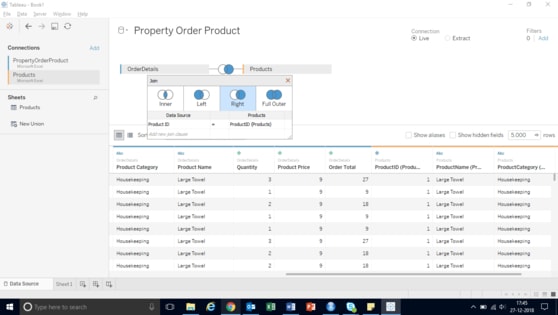
Tableau Full Outer Join
Let us change Join type from Right Join to Full Outer Join as shown below
You have successfully used joins in Tableau to get required data source.
Tableau Data Blending
Tableau Data Blending is extremely useful to join data from two data sources. If you want to generate a tableau report using multiple data sources then we can apply Tableau Data Blending technique.
Data Blending in Tableau requires at least one common field in both data sources. It can be a integer or a string, doesn’t matter.
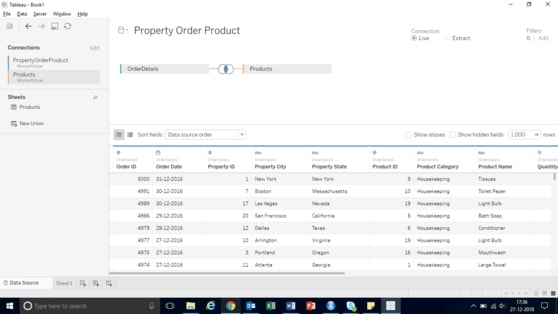
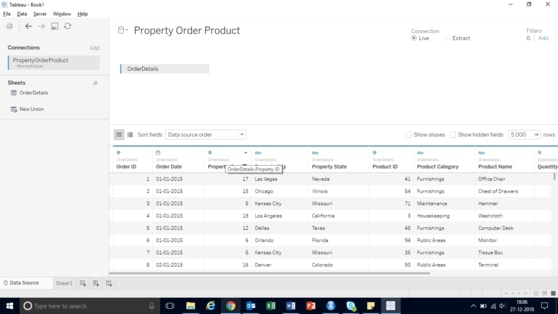
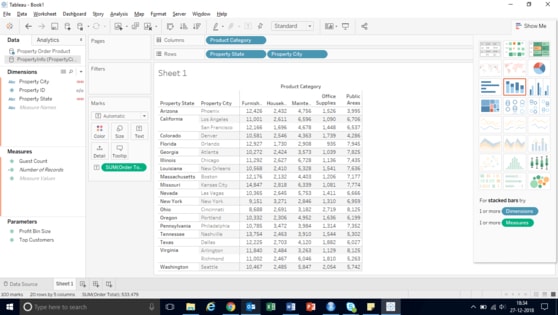
First, we connected to Property Order Product.xlsx workbook & added Order Details sheet to data region as shown below
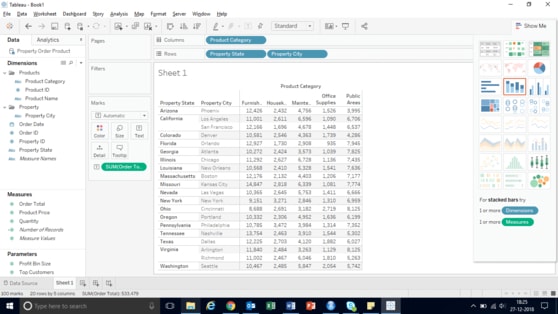
In this example, Our requirement is to create table report with product category, Property state & property city with Order totals. So, we created a simple table report with those details. Let us see report preview.
Scenario: Suddenly, Client changed requirements & asked us to add few other details. Here real problem is, those data are present in other files/data source. It means, we have to combine few columns from one Excel Sheet & few from other Data source. This is what actually Tableau Data Blending refers to.
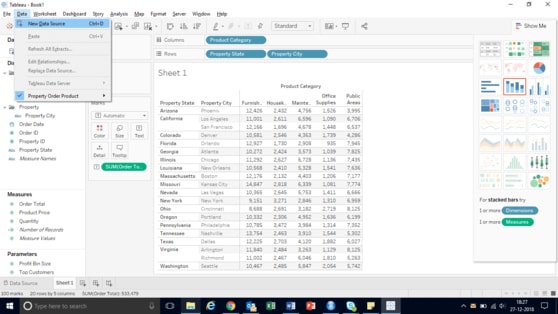
To do this, Please navigate to Data menu & select New Data Source option from Menu as shown below or click on Cylinder symbol
Once you select New Data Source, you will get a window as like below screenshot.
From below screenshot, you can observe that we selected PropertyCityState.xlsx file.
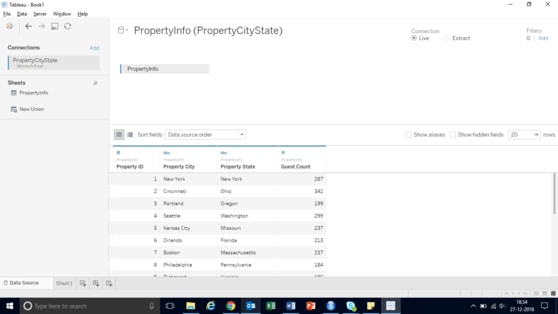
The following screenshot will show newly added data source
Let us add Property city to Rows Card. From below screenshot you can observe that Tableau is displaying little orange tick mark at Property city.
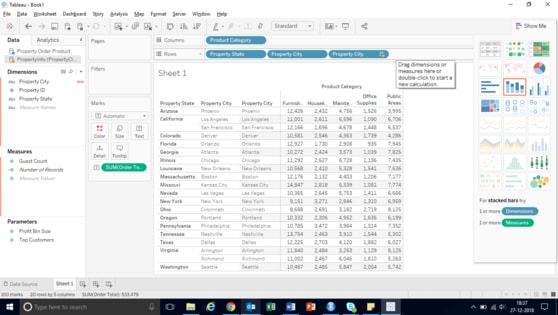
You have successfully created Tableau report using data blending. If those column names don’t match, try changing column names or edit relationship in data tab.
Show Me pane
Show Me pane holds most common charts in Tableau. You can use any of these charts to view that data. In order to open that window, click Show Me on that toolbar that we have shown below.
Clicking that Show Me tab will open that following window
Following is that list of charts that are available in Show my window.
- Text Label
- Heat Map
- Highlight Table
- Symbol Maps
- Maps
- Pie Chart
- Horizontal Bars
- Stacked Bars
- Side-By-Side Bars
- Treemap
- Line Chart
- Discrete Lines
- Dual Lines
- Area Chart
- Discrete Area Chart
- Dual Combination Chart
- Scatter Plot
- Histograms
- Box and Whisker Plots
- Gantt Chart
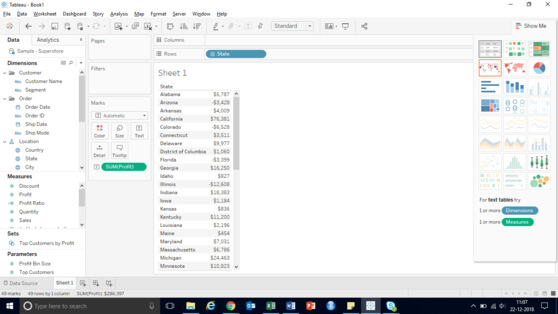
Use Tableau Show Me to create a Table
For that Demonstration purpose, we are Dragging State field from Measures region to Rows field, and profit to Column field. Next, we selected that Text Labels from Show me. that you can see from that below screenshot, tableau has created that Table report.
Text Label
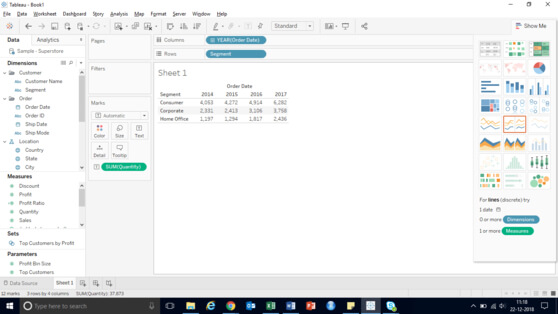
In Tableau, we can create Pivot data (also called which Text Labels, or Crosstabs) by placing one dimension in Column shelf, and another dimension in Row shelf.
Steps Involved
Initially, drag and drop that Segment from Dimensions Region to Rows Shelf, and Order Date (Year) to Column Shelf.

Next, drag and drop that Quantity from Measures Region to Text field present in Marks Shelf.
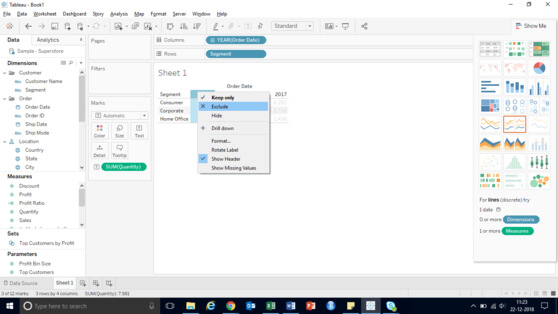
From that above screenshot you can see that 2014 doesn’t have much difference. so, we are excluding 2014 from that report by selecting that column and selecting that Exclude option from that tool tip.
Next, drag and drop that State from Dimensions Region to Rows Shelf on that left side of that Segment.
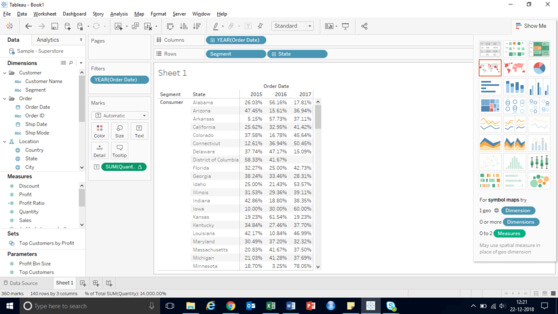
Above screenshot will show you that complete cross tab report.
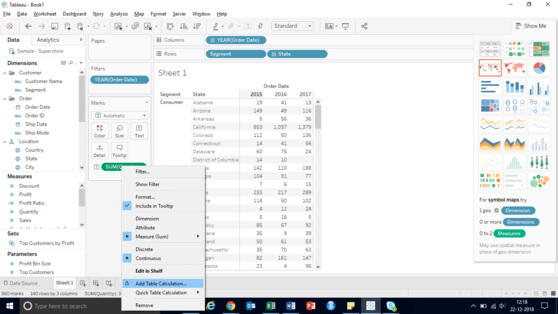
Add Table Calculation to Tableau Text Label
In order to add that table calculation, please select, and right-click on that Quantity will open that context menu. here you have to select that Add Table Calculation option which shown below.
Once you select that Add Table Calculation option, a new window called Table Calculation will be opened. Here we are selecting that Calculation Type which that percent of Total, and Computed by Table (crosstab). Remember, we will discuss that Table calculations in another article and here we will focus on crosstabs report only.
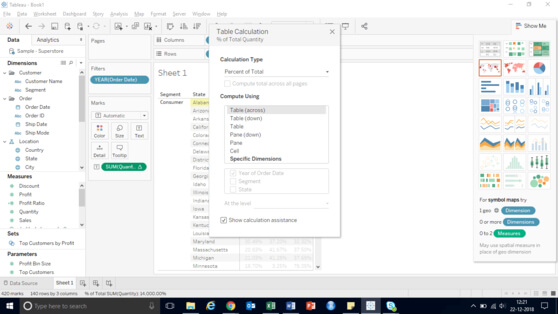
The following screenshot will show you that Cross tab report along with that Percentage total. which you can see, we got that maximum percentage of sales in 2013 compared to 2012, and 2014.

 +1 201-949-7520
 +91-9707 240 250